Goldman Sachs Q3 Earnings Showed Growth: Wall Street Wanted More
Posted On Oct 14, 2026 by Grayson Cavern
Goldman Sachs (NYSE: GS) just posted a 39% jump in earnings per share, yet its stock is trading near $892 after falling from July’s peak around $1,150. The selloff looks strange beside the headline numbers, but a closer look at the third-quarter results reveals why investors may be reluctant to chase the stock. Revenue and earnings are growing year over year, although the trading surge that powered much of that growth has cooled from last quarter.
Table of Contents
Goldman reported $18.68 billion in net revenue, up 23% year over year, and diluted EPS of $17.01, up 39%. The firm’s core franchises are producing, just as we argued in Monday’s preview. The catch is that revenue fell 8% sequentially, and earnings declined 20%. The business is stronger than it was a year ago, but the pace of improvement has become harder to sustain.
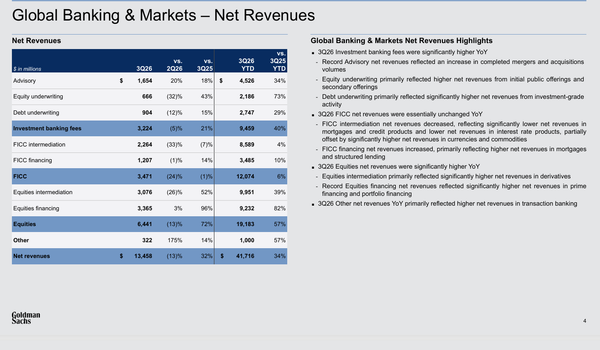
The standout number was equities revenue, which climbed 72% year over year to $6.44 billion on stronger financing and derivatives activity. Investment banking fees also delivered, rising 21% to $3.22 billion, with advisory revenue up 18% and equity underwriting up 43%. These are meaningful gains across two franchises that investors want to see firing together.
But the sequential comparison complicates the bullish read. Equities revenue fell 13% from Q2’s $7.42 billion, while Global Banking & Markets revenue declined 13% to $13.46 billion. FICC brought in $3.47 billion, down 1% year over year and 24% sequentially as intermediation weakened across mortgages, credit and interest-rate products.
That is the tension we are dealing with. Goldman has regained considerable earnings power versus last year, but a meaningful share of the latest growth came from businesses whose revenue can swing with market conditions and client activity. A 72% year-over-year increase in equities looks powerful on the scorecard; the pullback from Q2 shows why investors cannot simply extrapolate it forward.
Investment banking offers another clue, in that fees are rising, but the firm’s investment banking backlog declined from the end of Q2 and remained slightly below its year-end 2025 level. Completed transactions are generating revenue today. The backlog is the forward indicator, and it does not yet point to an accelerating pipeline.
Asset and Wealth Management Is Picking Up the Slack
While trading cooled, Asset & Wealth Management moved in the opposite direction. Revenue increased 14% year over year and 10% sequentially to $5.05 billion. Management and other fees reached $3.59 billion, while incentive fees climbed to $587 million from $112 million in Q2.
That sequential gain gives Goldman a second engine as Global Banking & Markets normalizes. Recurring management fees can provide a more durable revenue base than trading, and the firm is benefiting from a business mix that extends beyond its markets franchise.
Still, I would not annualize the incentive-fee jump. Fund distributions contributed to the increase, so that line can fluctuate from quarter to quarter. The stronger evidence is the broader growth in Asset & Wealth Management revenue and management fees, which supports the argument that Goldman is building earnings capacity outside its most volatile businesses.
This is where the continuity from Monday’s preview becomes clearer: the core-franchise strategy is producing growth, but the latest report also shows why diversification matters. Asset & Wealth Management grew sequentially while Global Banking & Markets contracted. That offset helped Goldman deliver a strong year-over-year result despite the cooling in trading.
Costs Are Rising, but Efficiency Has Improved
Goldman’s operating expenses increased 20% year over year to $11.31 billion, driven by transaction-based expenses, compensation and charitable contributions. That is a hefty increase, although revenue grew 23%, allowing the firm to absorb the higher cost base while expanding earnings.
The year-to-date efficiency ratio adds useful context. Goldman reported 59.4% for the first nine months of 2026, down from 62.1% over the same period in 2025. The firm has generated more revenue relative to its expenses over the year to date, even with the elevated spending in the latest quarter.
Goldman also reported an annualized return on common equity of 18.7%, while book value per share rose 1.4% during Q3 to $372.64. Those figures show a profitable franchise still building shareholder value. Yet the sequential decline in revenue and EPS means the next leg of the bullish case depends on Goldman sustaining those returns as trading conditions shift.
GS Needs to Reclaim Its Technical Ground
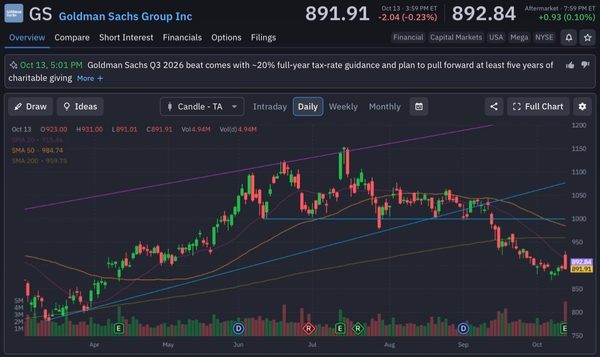
The chart has taken a beating. GS closed October 13 at $891.91, below its 20-day moving average at $915.46, its 50-day at $984.74 and its 200-day at $959.75. The stock has fallen from around $1,150 in July, and the $1,000 area that once provided support now sits overhead as resistance.
A reclaim of $915 would be the first sign that buyers are regaining control. The stock would then need to work through the $960 area and the $985–$1,000 zone to repair the broader technical damage. If sellers push GS below the recent $880–$890 area, the risk of another leg lower increases.
I remain constructive on Goldman’s underlying business. Investment banking fees are growing, equities remain substantially higher than last year, Asset & Wealth Management is expanding, and year-to-date efficiency has improved. But the sequential decline in earnings, weaker FICC revenue, and softer backlog make it harder to argue that the stock should immediately recover.
Today’s editorial pick for you
Etsy Q3 Earnings Preview: Can Its Recovery Keep Going?
Posted On Oct 13, 2026 by Ian Cooper
Etsy (NYSE: ETSY) heads into its upcoming earnings report with an encouraging story: shoppers are spending more on its marketplace, and sales growth has improved. Now investors want to know whether that progress can continue through the holiday shopping season.
Table of Contents
That makes this report about more than beating an earnings estimate. Etsy needs to show that its efforts to attract shoppers, encourage repeat purchases, and make products easier to find are building a stronger business.
There are reasons for optimism. But with the recovery still developing, Wall Street will have plenty to examine beneath the headline numbers.
Analysts estimate about 81 cents per share on revenue of $680.5 million. Management has already provided some useful targets. Management previously forecast third-quarter gross merchandise sales of $2.53 billion to $2.58 billion, representing growth of approximately 4% to 6% from a year earlier. It also projected an adjusted EBITDA margin of 28% to 30%, a profitability measure that excludes interest, taxes, depreciation, amortization, and certain other expenses.
Revenue reached $668.3 million, up 6.2% on a continuing-operations basis. Looking specifically at the Etsy marketplace and excluding Reverb from the previous year’s comparison, revenue increased 9.3%. Etsy marketplace gross merchandise sales rose 7.5% to approximately $2.58 billion. Gross merchandise sales, or GMS, measures the value of merchandise sold through the platform. That differs from Etsy’s revenue, which comes from fees and services associated with running the marketplace.
Source: Etsy
The third-quarter report should help establish whether the company’s recent improvement is becoming a dependable trend. Results near the upper end of management’s sales outlook would strengthen that argument.
Are More Shoppers Coming Back?
The buyer numbers may offer the clearest test. The company reported about 87 million active buyers at the end of the second quarter, down 0.4% from a year earlier. Meanwhile, spending per active buyer over the preceding 12 months increased 2.8% to $124.
That is encouraging, but it leaves room for improvement. Higher spending helps, while a growing customer base would give the recovery broader support.
Investors should also look at what is driving those larger purchases. Management said higher average order values were the biggest contributor to second-quarter merchandise-sales growth, with higher listing prices the main factor. Purchase frequency remained slightly below year-earlier levels, although the decline was easing.
For the next report, stronger repeat purchasing would be particularly welcome. A shopper who returns regularly creates more opportunities for sellers and gives Etsy additional chances to generate fees.
Profits and Buybacks Also Matter
Etsy is also reshaping the business around its main marketplace. The company completed its Depop sale to eBay in July and announced a new $2 billion share-repurchase authorization in August. It also outlined a workforce reduction of roughly 12% as part of its reorganization. Investors will want to understand how those changes affect expenses, investment priorities, and future earnings.
Buybacks can help earnings per share by reducing the number of shares outstanding. However, that makes it useful to examine total profit alongside per-share results. A stronger earnings figure carries more weight when the underlying business is improving too.
The same applies to margins. Better profitability is encouraging, particularly if Etsy can achieve it while continuing to attract customers and support sellers.
The Holiday Outlook Could Decide the Reaction
The biggest question may be what happens next. Investors will be listening for management’s assessment of holiday demand, promotional spending, and shoppers’ willingness to purchase discretionary items.
A solid third quarter could lose some shine if the company sounds cautious about the months ahead. Conversely, improving buyer trends and a confident outlook could make the recovery more convincing.
For Etsy, the opportunity is straightforward: keep shoppers engaged, give them reasons to return, and turn those visits into profitable growth. This earnings report should show how much closer the company is getting.





Tidak ada komentar:
Posting Komentar