Oklo’s (NYSE: OKLO)Q2 results reflect a shift echoed by its price action, suggesting there is nothing but upside ahead. The caveat is that, robust and improving as the outlook is, the upside is relative to market dynamics, which also suggest volatility, the potential for whipsaw action and sharp, potentially long-lasting corrections.
The critical details are revenue and the timeline to profitability. The company shifted from a pre-revenue pure-play to its initial revenue phase in Q2, outperforming expectations while accelerating its investment plans. Initial revenue is microscopic—just over $1 million—but is expected to grow as projects advance and capabilities scale.
Oklo’s Revenue to Ramp Exponentially Over the Mid- and Long Term
A small Colorado company has secured rights to technology that could prevent the U.S. public power grid from collapsing — and billionaire Sam Altman is now an investor.
This under-the-radar firm is drawing serious attention from those watching the energy infrastructure space closely.
Oklo’s growth trajectory is underpinned by a three-pronged approach, with only the first phase in play today. That phase involves radioactive isotopes useful for health and industrial applications. Revenue is expected to ramp incrementally in the second half of 2026 and then more aggressively in 2027.
The second prong involves fuel fabrication and recycling, which is expected to begin generating revenue in 2027. Deals with companies such as Centrus Energy Corp (NASDAQ: LEU) set Oklo up to secure its own supply while providing services to the industry. The most important prong, however, involves small modular reactors, which are slated for deployment by 2028. They will account for the bulk of the company’s revenue-generating capacity.
Looking ahead, the forecast is robust, with consensus estimates suggesting an exponential growth curve. Revenue is expected to ramp to the $300 million to $400 million range by 2030 and then reach the mid-single-digit billions by 2035. Profits are expected early in the next decade but may arrive sooner if project advancement accelerates. The company recently joined an effort involving hyperscalers and the Trump administration to reduce the time and cost of deployment.
Oklo’s Loss Widens, but Dilution Threat Fades
As counterintuitive as it may be, Oklo’s widening loss is offset by its causes and the fading threat of dilution. Losses are tied to strategy advancement and project derisking rather than increasing operational losses. The balance sheet is also well-capitalized, leaving little threat of additional dilution.
Although dilution has been a factor, it has increased the company’s capitalization and capacity to execute its strategy. Oklo’s more than $3 billion in cash, equivalents and investments provides a multiyear runway. In this scenario, Oklo won’t need a cash infusion until well after its first two revenue streams have begun ramping, if at all. That reduces the threat of future dilution and, along with it, short-selling pressure.
Short selling is a factor in OKLO’s price action and potential for a reversal. Short sellers leaned hard into this trade, capping gains in late 2025 and driving the stock price down approximately 80% from its high. However, they will likely begin covering their positions given the transition to revenue, improving outlook and capital runway.
Deeply Oversold, Oklo’s Market Is Ripe for a Rebound
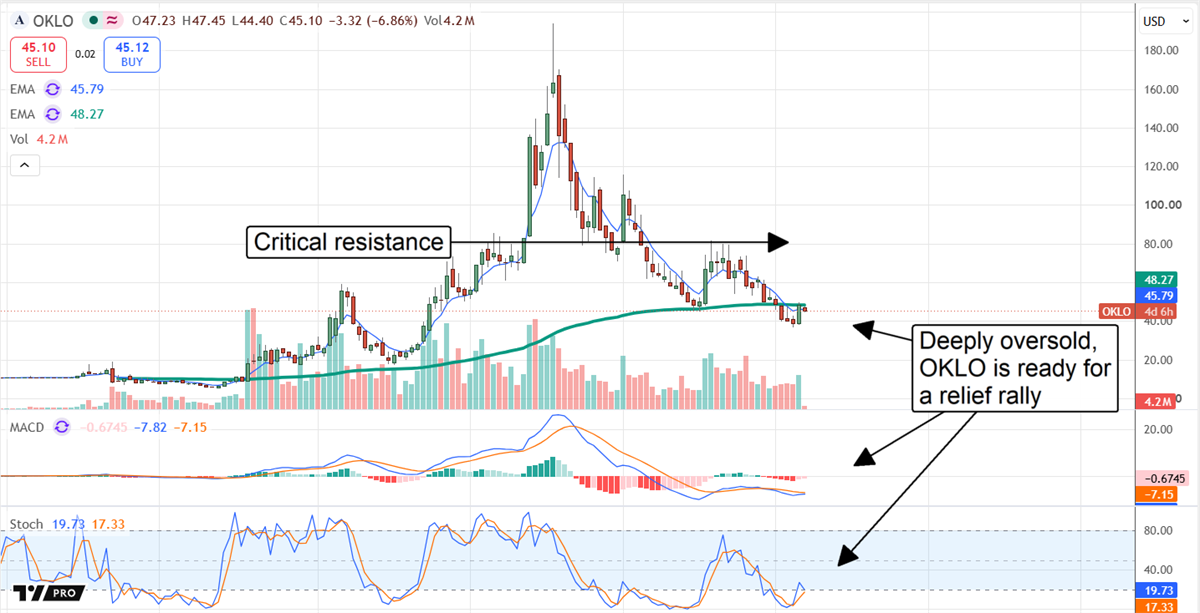
Oklo’s market sell-off hit extreme lows in summer 2026, setting up a potential relief rally in Q3. The lows were accompanied by significant divergences in the MACD and stochastic indicators, reflecting weakening bearish control and a high probability of a rebound. The question is how high OKLO’s price may go, and the spring highs near $80 are the likely target. This is the strongest technical target available, aligning with analysts' sentiment trends and the consensus estimate, which is just a few dollars higher.
In this scenario, $80 could trigger a sell-off, potentially a deep one, as the market establishes a base and forms a more obvious reversal pattern. Not only does $80 represent approximately 100% upside from recent lows, but it also marks a significant technical resistance point that could trigger profit-taking and short selling.
Oklo’s next major milestone is the ramp-up of isotope production at the Idaho test facility. It will be followed by the commissioning of a Texas isotope reactor sometime in late 2027. The biggest risks revolve around timing, including regulatory hurdles and construction delays. Mitigating factors include government support, which helps accelerate and derisk the projects, but it does not eliminate the possibility of delays or roadblocks.
What the market gets wrong about Oklo is that it is neither a flash-in-the-pan AI-adjacent play nor a traditional electric utility with high cash burn and a long pathway to revenue. Instead, it is a multipronged play on nuclear technology, including high-margin green energy. While the runway to revenue and profits is long, deployments appear likely, as revealed by early testing, and the potential for cash flow and profits is immense. Once operational, Oklo’s reactors, which are well-suited for a wide range of applications, will run for 10 to 20 years without refueling. This will allow its fuel business to generate high-margin revenue, while the isotope business does the same.
I want to make sure you’re aware of our best opportunity before it expires at midnighttonight.
With most of the major indexes trading at or near all-time highs, it looks like there’s a lot more upside ahead.
The AI boom is still accelerating, earnings growth is soaring, productivity is climbing, and small-caps are helping lead the rally in a big way.
In fact, I believe the market's biggest rally of 2026 is yet to come.
So what’s the single best way to find the stocks most likely to climb the most?
That’s where the unbiased, mathematical Zacks Rank comes in. Since 1988, even through three recessions and multiple corrections, it has averaged an astonishing gain of +23.9% per year. That beats the S&P 500 more than 2X over!
Now imagine following our team of experts’ real-time buy and sell recommendations as they harness the predictive power of this stock-picking system. The gains could be life-changing.
That’s why I’m opening up our highest level of membership at the lowest price available.
It literally gives you lifetime access to all of our trading and investing services atafractionoftheirworth. Benefit for benefit, dollar for dollar, it’s the greatest value we offer:
•
A deep discount on your one-time membership payment. The temporary savings are unbelievable and there will never be extra fees or add-on charges.
•
Permanent access to the real-time buys, sells, and market commentary of all our private portfolios. Using the Zacks Rank, our experts closed 139 double and triple-digit winners already this year. Past gains reached as high as +220%, +499%, +627%, and even +2,027%.¹ While not all picks will be winners, just one of them could more than cover the cost of your membership.
•
Permanent access to Zacks Premium. Find winning stocks on your own with powerful research, tools and analysis, including the Zacks #1 Rank List, Equity Research Reports, Zacks Earnings ESP Filter, Premium Screener and more.
•
Permanent access to private Special Reports. Stay on top of trends like Renewable Energy, Semiconductors, Artificial Intelligence, EVs, and more with stock ideas that have gain potential similar to Apple, Amazon, Tesla and Nvidia in their early days.
•
Money-Back Satisfaction Guarantee. If the service has not exceeded your expectations, you can cancel up to 90 days after your payment and receive a full refund for it.
•
Unprecedented Money-Back 3-Year Performance Guarantee. If we don’t help you beat the market, we’ll refund your subscription.
Click the button below to see today’s unbelievable savings and all the benefits Zacks’ Greatest Investment Value has to offer.
It's your final chance to use the predictive power of the Zacks Rank system to the utmost, for pursuing and sustaining life-changing wealth.
Remember, the deadline to take advantage is Sunday, August 16 – midnight tonight.
¹The results listed above are not (or may not be) representative of the performance of all selections made by Zacks Investment Research's newsletter editors and may represent the partial close of a position. Access grants you a comprehensive list of all open and closed trades.
This free resource is being sent by Zacks.com. We look for investment resources and inform you of these resources, which you may choose to use in making your own investment decisions. Zacks is providing information on this resource to you subject to the Zacks "Terms of Service". https://www.zacks.com/terms_of_service
Past performance is no guarantee of future results. Inherent in any investment is the potential for loss. This material is being provided for informational purposes only and nothing herein constitutes investment, legal, accounting or tax advice, or a recommendation to buy, sell or hold a security. No recommendation or advice is being given as to whether any investment is suitable for a particular investor. It should not be assumed that any investments in securities, companies, sectors or markets identified and described were or will be profitable. All information is current as of the date of herein and is subject to change without notice. Any views or opinions expressed may not reflect those of the firm as a whole. Zacks Investment Research is not a licensed securities dealer, broker or U.S. investment adviser or investment bank.
The Zacks #1 Rank Performance covers the period beginning on January 1, 1988 through July 6, 2026. The performance is the equal weighted performance of a hypothetical portfolio consisting of stocks with a Zacks Rank of #1 that was rebalanced monthly from January 1988 through December 2013 and weekly from 12/31/13 through Monday's open on July 6, 2026. For each stock with a Zacks Rank #1 at the beginning of the month, the total return during the month was calculated as the % change in the price of the stock from the closing price of the prior month to the closing price of the current month plus any dividends received during the month. The monthly individual stock returns were then averaged to determine the portfolio return for the month. For each stock with a Zacks Rank #1 at the beginning of the week, the total return during the week was calculated as the % change in the price of the stock from the opening price for the week to the opening price of the next week plus any dividends received during the week. The weekly individual stock returns were then averaged to determine the portfolio return for the week. If no month-end price or week end open price was available for a stock, it was not included in the portfolio return for the month or the week. The monthly and weekly returns were compounded to arrive at the annual returns. The annualized return is the annual return that, had it been achieved in each year or portion of a year, would have compounded to create the total return over the full time period. These returns are based on the list of Zacks Rank #1 Stocks that was available to clients of Zacks as of the beginning of the month, when returns were calculated monthly, or as of the beginning of the week when returns were calculated weekly. These returns are higher than the returns an investor could achieve investing real money in a portfolio of Zacks Rank #1 stocks because the returns of the hypothetical Zacks Rank #1 portfolio exclude a number of costs, including commissions incurred for trading, the average bid ask spread, the price impact of the trading and, prior to 2013, in those months when the end of the month fell on Friday, Saturday or Sunday, the overnight return from the month end close to the open on the next trading day. The S&P 500 is an unmanaged index. Visit https://www.zacks.com/performance_disclosure for information about the performance numbers displayed above.
Zacks Emails
If you would prefer to not receive future profit-producing emails from Zacks.com the primary purpose of which is the commercial advertisement or promotion of a commercial product or service, then please click here and confirm your request. If you have trouble with the unsubscribe link, please email support@zacks.com.
Zacks Investment Research
101 N Wacker Drive, Floor 15
Chicago, IL 60606
*Mode Mobile recently received their ticker reservation with Nasdaq ($MODE), indicating an intent to IPO in the next 24 months. An intent to IPO is no guarantee that an actual IPO will occur. *The Deloitte rankings are based on submitted applications and public company database research, with winners selected based on their fiscal-year revenue growth percentage over a three-year period. *Please read the offering circular and related risks atinvest.modemobile.com. *Mode revenue and EBITDA numbers include full year revenue and EBITDA of businesses acquired by Mode Mobile in 2025.
Exclusive Headlines
Applied Materials' Rally Left No Room for Another Beat
Applied Materials just posted the highest sequential revenue growth in its history. Revenue reached $9.1 billion, up 25%. Non-GAAP EPS of $3.50 beat both major consensus estimates, and management raised its outlook for the current quarter above where analysts had it. Shares still fell about 5% after hours.
The reaction is worth sitting with, because on paper there is not much to complain about. CEO Gary Dickerson told analysts the company has made upward revisions to its full-year revenue forecast twice in the past three months. Largest customers are giving longer commitments and rolling eight-quarter forecasts. CFO Brice Hill pointed to a thirteenth consecutive quarter of year-over-year gross margin expansion.
Pre-earnings concerns did not hold up. Non-GAAP free cash flow was $2.33 billion, up 14%. Operating cash flow topped $3 billion for the first time in company history. On China, Hill said the region grew this year and should keep growing next year, led by investment in older 28-nanometer foundry and logic manufacturing, a segment less exposed to export restrictions.
Semiconductor Systems grew to $7 billion in revenue. Product mix is now roughly two-thirds foundry and logic, about a quarter DRAM, and the rest flash. Hill said growth in that segment is now running above the "30-plus percent" pace cited last quarter. Company-level gross margins have risen about 300 basis points over three years, partly attributable to value-based per-tool pricing changes rather than cost cuts alone. That is a different kind of margin story than one built purely on scale.
None of this points to a company whose growth story cracked. What it does point to is a stock that had already priced in a great deal of good news. Shares were up roughly 105% year to date and around 200% over the trailing twelve months heading into the print. A rally of that size raises the bar for what counts as good enough. A beat that lands above the midpoint of guidance but not above its ceiling may simply not clear that higher bar for a stock priced closer to perfection.
Applied Materials proved this quarter that demand, pricing power, and cash generation are all still moving in the right direction. What it has not yet proven is that a stock already up 200% has room left to reward being right again.
Super Micro's Backlog Is Outrunning Its Cash
Super Micro Computer closed fiscal 2026 with a number that should worry anyone tracking how fast the AI server maker is growing. Operating cash flow for the year was negative $6.8 billion. That is the cost of chasing a backlog management says now tops $60 billion in new orders.
The Q4 print capped a year of contradictions. Revenue of $11.12 billion, up 93%, landed near the bottom of the $11 to $12.5 billion guidance range. GAAP diluted EPS of $1.62 and non-GAAP EPS of $1.70 both blew past the top of their guided ranges. Non-GAAP gross margin of 17.6% more than doubled the 8.2 to 8.4% range management had set. CFO David Weigand attributed the revenue shortfall to "delays in customer readiness" and said the revenue will show up in coming quarters. Three-quarters of the margin gain came from favorable customer and product mix, with the rest from lower tariff costs and reduced inventory reserves.
The more concrete concern is working capital. The cash conversion cycle stretched to 149 days from 106 in Q3. Days inventory outstanding rose to 119 from 106. Full-year operating cash flow swung from positive $1.66 billion in fiscal 2025 to a $6.8 billion use of cash in fiscal 2026. Super Micro raised $5.6 billion in Q4 alone, split between common stock and a new mandatory convertible preferred paying a 7% coupon.
The order book raises its own questions. One customer accounted for 28% of the year's revenue. Analyst Asiya Merchant asked directly whether large data center customers are increasingly buying components straight from ODMs instead of going through Super Micro. Liang's response focused on power and cooling readiness rather than a numbers-based rebuttal. A previously disclosed board investigation remains unresolved, with Weigand saying only an update would come "shortly."
Super Micro no longer has to prove demand exists. What it has not yet proven is that it can fund the growth without repeating fiscal 2026's cash drain or leaning further on capital markets.
P.S. I’m also giving away the name and ticker symbol of my #1 “Accelerated AI” play I believe everyone should buy right now — for free. Click here for more info.
Today’s editorial pick for you
Archer Aviation’s Bold Pivot Could Transform ACHR Stock
Posted On Aug 12, 2026 by Chris Markoch
Archer Aviation (NYSE: ACHR) just delivered a second-quarter report that had little to do with normal headline numbers like revenue and earnings per share (EPS). The air taxi developer posted a wider-than-expected loss, but investors barely blinked.
Table of Contents
Instead, they focused on two moves that are reshaping what Archer actually is: a planned acquisition of three Boeing (NYSE: BA) units, and a jointly developed defense aircraft with Anduril Industries. Together, these deals mark Archer’s transition from a single-purpose civilian air taxi startup into a diversified aerospace and defense platform.
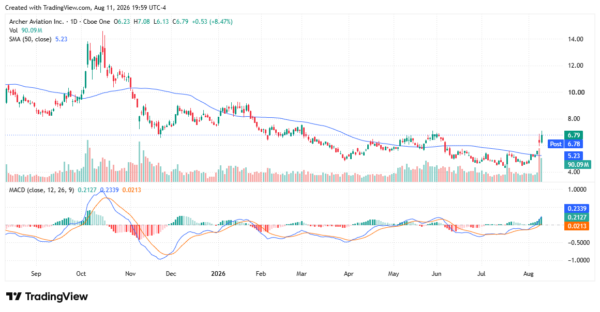
The stock jumped more than 8% following the report, and the technical chart shows a stock breaking out of a months-long downtrend. That reaction wasn’t about EPS, or lack thereof. It was about revenue visibility and strategic direction.
Archer still lost money in the quarter, and the FAA certification path for its Midnight aircraft remains a work in progress. Those are real considerations. But the bigger story is that Archer no longer looks like a company betting everything on one aircraft and one regulatory outcome. It now has defense contracts, a hardware acquisition that adds meaningful revenue, and a second aircraft platform aimed squarely at military budgets. That’s a fundamentally different investment case than the one that existed a year ago.
Boeing Deal Turns Revenue Story From Promise Into Progress
Archer’s quarterly revenue came in at $5 million, up sharply from the prior quarter. That’s still a small number for a company burning through more than $150 million a quarter in operating cash. But the Boeing transaction changes the trajectory. Archer agreed to acquire Boeing’s Wisk Aero, Insitu, and SkyGrid businesses in exchange for a Boeing equity stake, a deal expected to close by year-end.
Insitu alone is expected to add more than $200 million in annual revenue once the acquisition closes. That figure dwarfs Archer’s current quarterly sales base. It also gives the company an established, revenue-generating defense drone business to lean on while Midnight works through certification. Boeing’s involvement as both a seller and an investor adds a layer of validation that resonates with institutional investors closely watching the FAA process.
Management has been clear that this deal won’t eliminate Archer’s cash burn. It will, however, offset a meaningful portion of it while diversifying revenue away from a single aircraft program. For a company that has spent years fielding questions about “when,” the Boeing deal gives analysts something closer to “how much” and “how soon.”
Chart Shows Textbook Setup for a Short-Term Squeeze
The technical picture backs up the fundamental shift. Archer shares surged 8.47% on heavy volume above 90 million shares, closing near $6.79 after opening at $6.23. That single-day move pushed the stock decisively above its 50-day simple moving average, which sits at $5.23. Price had spent nearly ten months grinding below that average, a pattern that typically signals sustained selling pressure.
The MACD indicator is also flashing an early bullish signal. The MACD line, at 0.2127, is closing in on the signal line at 0.2339, with the histogram narrowing toward a potential crossover. That kind of setup, paired with a volume spike well above the recent average, often precedes short covering. Archer has historically carried elevated short interest given the skepticism around eVTOL timelines.
If momentum holds and the stock clears resistance near recent swing highs, short sellers who have been leaning the wrong way could accelerate the move. That doesn’t guarantee a sustained rally, but it does raise the odds of a sharp, fast short-term move higher.
Certification Concerns Are Real, But Investors May Be Overstating Them
Some investors remain frustrated by the lack of a firm certification date for Midnight. Archer isn’t providing a hard timeline, and that ambiguity has weighed on sentiment for months. Combined with continued unprofitability, it’s easy to see why some remain cautious.
But it’s worth separating two very different problems: a slow process and a failing process. Nothing in Archer’s disclosures suggests the FAA has raised doubts about eventual certification. Piloted city-to-city Midnight flights completed in July run in coordination with the FAA and point toward progress rather than stagnation.
Every eVTOL manufacturer faces this same regulatory uncertainty. It isn’t an Archer-specific flaw; it’s an industry-wide reality of introducing a new aircraft category. Investors weighing Archer against that backdrop should judge the company by whether milestones keep coming, not by whether a specific date is named.
The Bigger Picture: A Broader, More Resilient Company
Archer’s second quarter reinforced a shift that’s been building for months. This is no longer a company whose fate rests entirely on one certification timeline. The Boeing acquisitions add real, near-term revenue. The Anduril partnership opens a defense channel with its own funding and demand drivers, independent of civilian air taxi adoption.
Risks remain. Cash burn continues, and integration of three new businesses adds execution complexity. But Archer now has multiple paths to relevance instead of one. For investors willing to look past quarterly losses, that diversification is the real story behind this earnings report.
Today’s editorial pick for you
There Still Might Be a Chance to Scalp Profits from Oracle Stock
Posted On Aug 12, 2026 by Joshua Enomoto
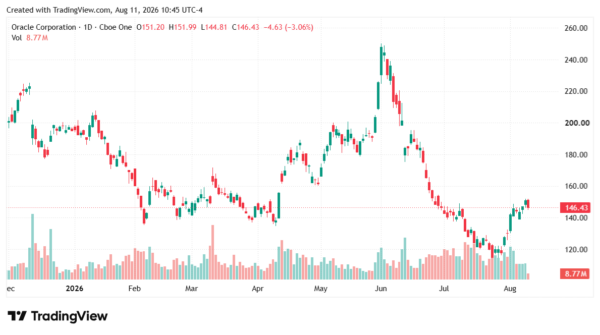
Despite wobbly circumstances in the broader economy, Oracle (NYSE: ORCL) has managed to string together an impressive performance. Sure, the overwhelming picture is of ORCL stock losing 22.5% on a year-to-date basis. Yes, it’s ugly, warranting fundamental concerns about the sustainability of artificial intelligence. At the same time, we must also acknowledge the ticker gaining nearly 15% in the trailing month.
Table of Contents
Now, the obvious question: is the swing higher in ORCL stock a fluke or can we anticipate further gains?
It’s here that routine financial publications will wax poetic about Oracle’s fundamentals to make their case, either bullish or bearish. While I’m not opposed to the idea of presenting context for ORCL stock, I have a suspicion that doing so is a redundancy. Let’s face it, ORCL is a popular security so you’ve probably already read up on the latest news.
Plus, the more important point is that whatever material public information that has been disclosed has likely been baked into the Oracle stock price. Yes, it might be the case that an independent contractor has found an insight that all the big institutions have missed. But I believe such circumstances are rare.
Next, someone may point to technical analysis to determine where ORCL stock may end up at some point in the future. Basically, the idea is that the past may give clues about what may happen tomorrow. In principle, I agree with this inductive approach. However, technical analysis as it is commonly practiced tends to be undisciplined.
Usually, a practitioner sees some sign or pattern and presumes a probabilistic forward response. But the main problem that I see is that the sign/pattern in question is unconditioned. Just because an analyst sees something in isolation doesn’t necessarily indicate — or even infer — that the target stock will move unusually compared to the random baseline.
ORCL Stock Still ‘Suffers’ From an Order Flow Imbalance
While we may have differences regarding the effectiveness of fundamental and technical analysis, I think we can all agree that equity market behaviors rarely occur in a vacuum (if ever). Advanced research has indicated that markets are reflexive — you can’t determine where Oracle stock may go next with absolute precision because participants respond to shifting circumstances.
It’s like the handicappers at Las Vegas. I’ve said this before but if two evenly matched football teams are scheduled to clash, the odds regarding who may win may be 50/50. But if one of the team’s starting quarterback goes down with an injury prior to kickoff, guess what? Suddenly, the odds may tilt to 65/35 or some other bias beyond 50/50.
No serious sports fan is going to question that dynamic. So, my hypothesis is, why would a serious market participant question an analogous situation for equities?
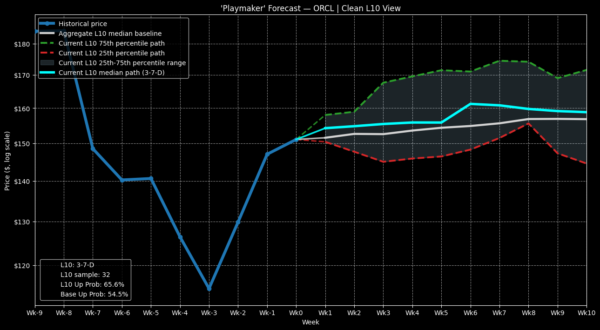
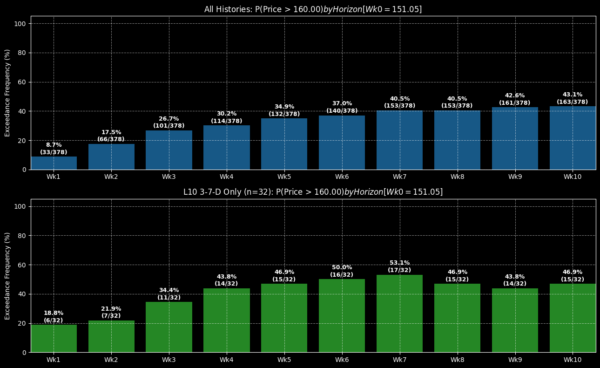
In some ways, you might say (metaphorically speaking) that ORCL stock has lost its starting QB to injury. In the last 10-week period, Oracle has only managed to print three weekly net positive candlesticks, thereby leading to a downward slope. This 3-7-D quantitative sequence is clearly bearish from an order flow balance perspective: there are simply more negative sessions than positive ones within an arbitrarily defined time period.
Okay, so what do we do with this information? We simply filter for past market data where Oracle stock flashed this exact quant sequence. We then observe what has happened in the next 10-week period following the flashing of this signal. Finally, we gather this data and discover what the median endpoint outcome is for each week of the forecasted period.
If you want to get into the nitty-gritty, you may read this StockEarnings article I wrote last week about ORCL stock. On Aug. 5, I stated that, based on that week’s 2-8-D signal, an intriguing idea is to consider the 145/150 bull call spread expiring Aug. 28. Back then, the share price was $144.39 at close. I can’t guarantee anything but on Monday, Aug. 10, the share price was $151.05.
What’s Next for Oracle Stock?
I’ve been talking extensively about ORCL stock so there’s a risk of overdoing the narrative. In mid-July, I stated that the 135/140 bull call spread expiring Aug. 21 was a good idea, especially because I calculated that the Black-Scholes-assigned probability of profit of 41.8% was likely too pessimistic.
Again, if you look through the technical charts as of the date of this writing (Aug. 10), you can see that I was justified in presenting my alternative probability of profit of 59.4%. I’m not saying that this inductive model is foolproof but under certain circumstances, it may provide a more realistic picture than whatever Wall Street is feeding you.
Given that Oracle stock is currently structured in a 3-7-D sequence, using basic statistics, the median endpoint price at the end of week 6 has been observed to be the equivalent of $160. Assuming that the above model is an accurate representation of future probabilities, there is a mathematical incentive to consider the Sep. 18 155/160 bull call spread.
This idea involves paying a net debit of $230 for the chance to generate a max profit of $270. Again, if the inductive model is accurate, over the theoretical long run, this call spread would likely enjoy positive expected value (EV). It comes down to basic math.
Of the 32 times that the 3-7-D signal has flashed on a rolling basis since January 2019, Oracle stock has risen above the equivalent of the $160 strike a total of 16 times at the end of week 6 (Sep. 18). From this framework, we would anticipate that the ORCL call spread will pay out $135 (0.50 x $270), while losing $115 (0.50 x $230).
If you play this exact same trade multiple times, you would expect a net gain of $20. That’s positive EV for you.
A Caveat Before You Trade
I have to be crystal clear because nuance tends to be lost in the internet. I am not God. I do not know the future. Merely, I am building an inductive case about what might happen tomorrow based on how prior trends fixed to a specific quant sequence have materialized.
But please note this: while the aforementioned signal may imply above-average behavior, this positive result is not logically necessary. My model is not at all presented as a static law of market performance. At any time, the overall sentiment regime can shift, either locally or broadly. If it does, all bets may be off the table.
So yes, I am making a presupposition and it’s up to you to decide whether you accept the premise or not. But also realize this: Wall Street (through Black-Scholes) is also making a presupposition. Therefore, only the trader can decide which presupposition they find more credible.
I presented my case; and now it’s up to you to choose.