This guide shows you the exact 15-minute window I trade, and how to spot the same setups the big funds are watching.
It’s yours for free.
Thomas Wood
P.S. This isn’t a 100-page novel. It’s a short, actionable guide you can read in about 10 minutes and put into action by tomorrow morning. Get it here.
Today’s editorial pick for you
Costco Q4 Earnings Beat Has a Catch Investors Should Know
Posted On Sep 25, 2026 by Ian Cooper
Costco (NASDAQ: COST) gave investors plenty to like in its latest earnings report. Shoppers spent more at its warehouses, membership fees grew, and online sales climbed. Revenue also came in above Wall Street’s expectations.
Table of Contents
But there is one important detail behind the company’s profit beat: A one-time tariff refund helped lift earnings. That means the sales numbers may be the better place to look when judging how Costco’s business performed.
If you have not grabbed your copy yet, this is your final warning.
This is the guide that shows you how to find one high-probability trade in the first 15 minutes of the day, execute it with as little as $75, and be done by 10:00 AM.
This is your last chance to get it without pulling out your credit card.
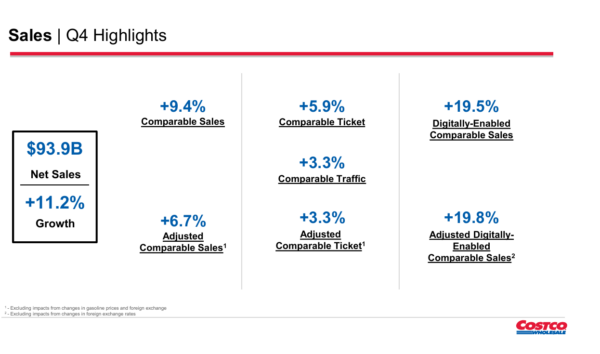
Costco reported $95.72 billion in revenue for its fiscal fourth quarter, up 12% from a year earlier. That was about $830 million more than analysts expected.
Some of that growth came from new warehouses. But Costco also sold more at locations that were already open. In the U.S., adjusted comparable sales rose 7.2%, beating the 6.85% growth analysts expected. Comparable sales also increased in Canada and other international markets.
For the company as a whole, comparable sales rose 6.7% when fuel was excluded, ahead of Wall Street’s 6.44% estimate.
Leaving fuel out helps give a clearer picture of shopping demand because gasoline prices can change the sales total even when customers buy about the same amount of merchandise.
Costco’s online business grew, too. Digital comparable sales increased at a double-digit pace during the 16-week quarter. The warehouses remain the heart of the business, but members are also spending more through Costco’s digital channel.
Membership Fees Added to Growth
Customers pay to shop at Costco, and those fees are an important part of its business. In the latest quarter, membership fee revenue rose 7% to $1.85 billion. Analysts had expected $1.83 billion. That increase is another encouraging sign for Costco.
The company depends on members seeing enough value in its prices and products to keep paying for access. The figures provided do not show exactly how much of the fee growth came from new members, renewals, or upgrades, but membership revenue was higher than Wall Street expected.
Why the Profit Beat Needs a Closer Look
Costco earned $6.57 per share for the quarter, up 15% from a year earlier and five cents above analysts’ estimates. However, that figure included a one-time benefit of 15 cents per share from tariff refunds. Without it, earnings would have been about $6.42 per share.
That does not take away from Costco’s strong sales. It simply means the reported profit beat tells only part of the story. Investors will want to see whether the company can keep growing earnings through its regular business in the quarters ahead.
Costco Keeps Expanding
Costco ended the period with 939 warehouses, eight more than it had at the end of its fiscal third quarter. Most are in the United States and Puerto Rico, where the company has 647 locations. It also has a large presence in Canada, along with warehouses across Mexico, Asia, Europe, Australia, and New Zealand.
For the full fiscal year, the company reported revenue of $303.15 billion, up 10.1%, and earnings of $20.76 per share. Both topped the estimates in the material you provided.
COST Remains Below Its 200-Day SMA
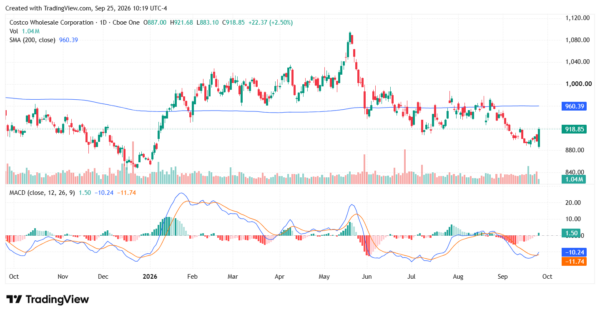
COST stock closed at $918.85 on Sept. 25, according to the chart provided. The stock remains below its 200-day simple moving average of $960.39, keeping the longer-term technical trend under pressure.
The chart does show a potential improvement in short-term momentum. The stock’s MACD histogram has turned positive at 1.50, while the MACD line at -10.24 has moved above its signal line at -11.74. That suggests downside momentum has eased following the stock’s decline through August and September.
However, the MACD lines remain below the zero line, and COST is still roughly 4.3% below its 200-day SMA. That leaves investors with two important technical levels to watch. Around $960 represents a potential test of the 200-day average, while the recent September low near $890 provides a reference point on the downside.
A move back above the 200-day SMA could change the technical picture, while a break below the recent low would indicate that the September decline remains intact. For now, the chart shows improving short-term momentum but a longer-term trend that has yet to recover.
The Takeaway for Costco Investors
Costco gave investors plenty of evidence that its business is still growing. Shoppers spent more at existing warehouses, digital sales rose at a double-digit pace, and membership fees came in ahead of expectations. The company also continued to open new locations, giving it another way to grow sales over time.
Still, the five-cent earnings beat looks different when we account for the one-time tariff refund. Without that 15-cent-per-share benefit, Costco would have earned about $6.42 per share, below Wall Street’s estimate. That does not erase the strong sales quarter, but it does put the profit headline in perspective.
The question now is whether Costco can turn that steady customer demand into stronger earnings from its regular operations. If comparable sales and membership fees keep growing, investors will have good reason to stay interested. They will also want to see profit growth that does not depend on another one-time boost.
Today’s editorial pick for you
Google’s Bold Suncatcher Project Could Transform AI Data Centers
Posted On Sep 25, 2026 by Ian Cooper
The race to build artificial intelligence has led tech companies to some surprising places. They have bought substantial amounts of chips, planned data centers and searched for enough electricity to keep them running. Now Google is looking somewhere farther away: orbit.
Table of Contents
Alphabet’s (NASDAQ: GOOGL)Project Suncatcher is exploring whether satellites equipped with Google’s AI chips could someday work together like a data center in space. The idea sounds futuristic because it is. Google describes it as a research project, with prototype satellites intended to test whether the hardware can operate in orbit.
Trump just made the boldest announcement of his political career: "In the next couple of years, I think we’ll substantially be cutting... or maybe cutting out completely... income tax."
A portion of this tariff flood is already being funneled into a federal payout system I call "Tariff Rebate Checks."
Checks worth up to $8,276 every quarter...
And the next wave of Tariff Rebate Checks is approaching fast.
If you do NOT act today, you could miss the next payout window.
The attraction is sunlight. AI computing needs a great deal of power, and getting that power has become a growing challenge for data centers on Earth. In the right orbit, Google says a solar panel could be up to eight times more productive than one on the ground and generate electricity nearly continuously. That could reduce the need for batteries and, in theory, give a network of satellites a steady source of energy.
The company’s plan involves Tensor Processing Units, or TPUs. These are the chips the company designs to handle AI workloads. Rather than putting a conventional data center building into orbit, Google is studying whether multiple solar-powered satellites carrying TPUs could be linked into a computing network.
Radiation and Heat Could Challenge Google’s Space AI Plans
Generating power in orbit would be useful. Keeping the equipment working there is another matter. A satellite and its chips must first survive launch. Once in orbit, the hardware faces radiation that can affect electronics.
Google says it has already begun testing how its TPUs respond to radiation, but a successful ground test does not settle every question about long-term performance in space. That is part of what the prototype mission is meant to investigate.
Then there is heat.
AI chips generate plenty of it, and space does not offer the airflow used to cool equipment in many Earth-based systems. Engineers would need a reliable way to move heat away from the processors so they can keep operating.
The satellites would also have to communicate quickly. One chip in orbit would be a small experiment. Google’s larger vision depends on many satellites sharing work across a network. If moving information between them is too slow, the available computing power may be much less useful than it looks on paper.
Finally, the economics must work. Satellites have to be built, launched and maintained. Hardware can fail or become outdated as newer AI chips arrive. Even if engineers prove that orbital computing works, Google would still have to show that it makes financial sense compared with expanding data centers on Earth.
Project Suncatcher Shows the Cost of AI Power
Tech companies are committing huge sums of money into AI infrastructure, while the eventual returns remain uncertain. If demand keeps growing, finding enough power and computing capacity could become even more valuable. If demand falls short of expectations, expensive projects may be harder to justify.
Space could eventually offer one answer, but the investment case is still years from being clear. The company first needs to prove its chips can work reliably in orbit, that satellites can exchange data effectively, and that the benefits are worth the costs.
For now, the most interesting thing about Project Suncatcher may be what it says about AI on Earth. When one of the world’s largest technology companies starts testing ways to run AI above the planet, it shows just how difficult the search for power has become.
Google’s research shows how far that search might go. Whether computing in orbit becomes a business or remains an intriguing experiment will depend on what the prototypes prove and whether the numbers eventually add up.
Technical Analysis: GOOGL Tests Key Support as MACD Turns Higher
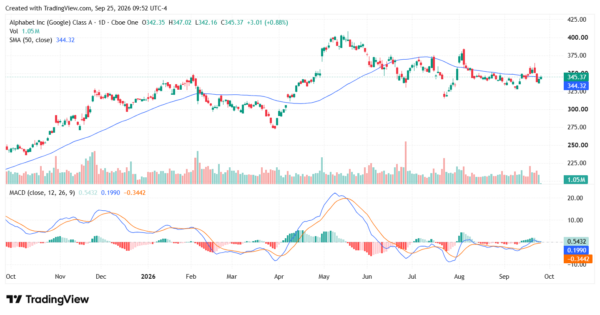
As of this writing, GOOGL is trading around $345, putting the stock just above its 50-day moving average near $344. The technical picture has improved modestly after the September rebound, with the MACD recently moving back above its signal line and the histogram turning positive. That suggests short-term momentum has improved, although the stock remains below the $375 area reached during the summer and well below its roughly $400 peak in May.
The 50-day moving average is the first level to watch on the downside. A sustained move below it could put the September lows around $330 back in focus. On the upside, a move through the $350-$360 area would give the stock room to challenge resistance around $375. Overall, the chart shows consolidation rather than a decisive new trend.




Tidak ada komentar:
Posting Komentar