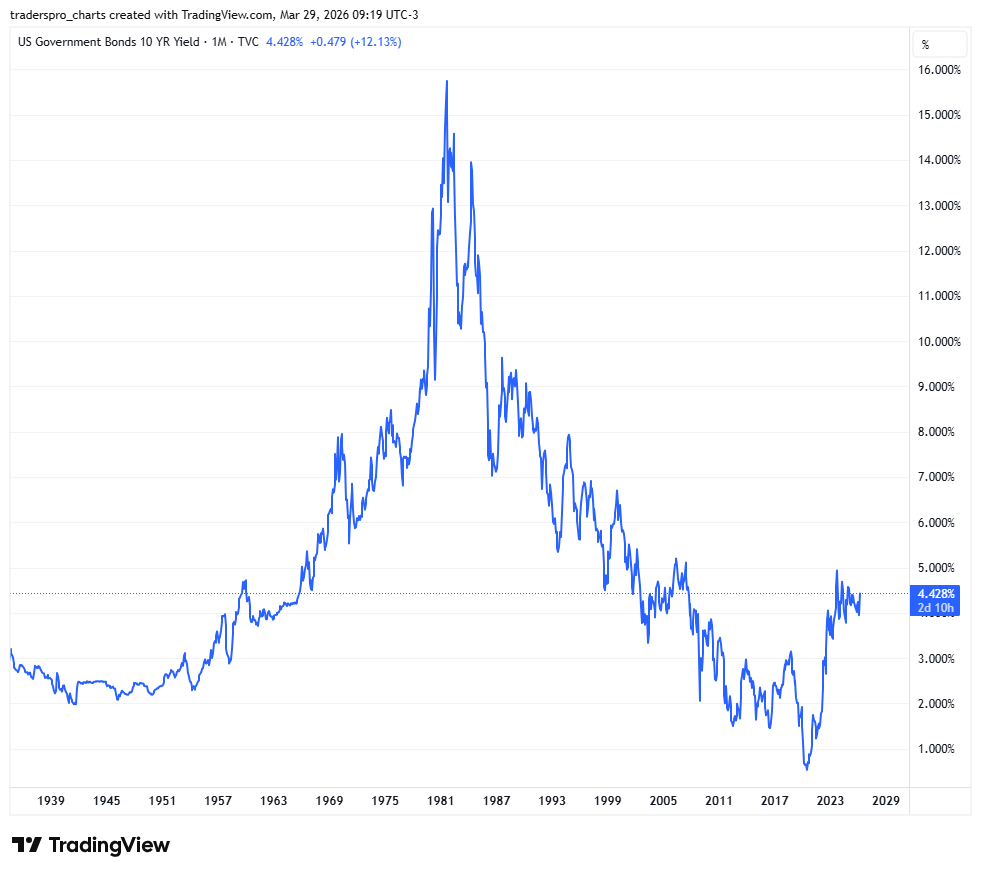
The Tide Went Out. It's Not Coming Back.What a 100-year chart of US Treasury yields tells us about where money is going — and where it's not.New To TradersPro? The Three ErasIn 1951, the yield on a 10-year US Treasury bond was about 2.5%. It was a sleepy number in a sleepy post-war world — Americans were buying houses, having babies, and trusting that the government would keep things stable. Nobody was particularly worried about interest rates. Nobody thought much about them at all. Then something started to shift. Slowly at first, then faster, then catastrophically. By 1981, that same 10-year yield had climbed to nearly 16%. Sixteen percent. Think about what that means — the US government was paying 16 cents in interest for every dollar it borrowed, every single year. Mortgages were at 18%. Buying a house meant committing to payments that would crush you. Businesses couldn’t borrow to grow. The economy felt like it was running through concrete. That 40-year climb from 1941 to 1981 is the first great era visible on this chart. It’s the story of post-war deficit spending, the abandonment of the gold standard in 1971, two oil shocks that hit the economy like freight trains, and a Federal Reserve that kept losing its nerve — hiking rates, watching inflation ease slightly, then blinking and cutting before the job was done. Inflation became self-fulfilling. It got baked into wage contracts, commodity prices, and expectations. The bond market in those years was sometimes called a “certificate of confiscation”. You lent the government money, and they handed it back worth considerably less than when you gave it to them.
The 40-Year Bull Market Nobody Called a Bull MarketThen came Paul Volcker, and everything changed. Volcker was the Fed chairman who decided the only way to kill inflation was to cause enough pain that nobody doubted his resolve. He pushed short-term rates to 20%. The economy went into a brutal recession. People were furious. Construction workers mailed him two-by-fours. Car dealers mailed him the keys to cars they couldn’t sell. It was deeply unpopular and arguably one of the most consequential acts of economic policy in modern American history. Because it worked. Inflation broke. And what followed was the second era on this chart — that long, majestic, almost uninterrupted slide in yields from the 1981 peak all the way down to near zero by 2020. Forty years of falling interest rates. I want to be very direct about what those forty years meant, because I think most people haven’t fully absorbed it. Falling interest rates are the single greatest tailwind an investor can have — and almost nobody who made serious money over the past four decades was doing so in a vacuum. They had that wind at their backs the entire time. Here’s the simple mechanics of it. When rates fall, future cash flows become worth more today — that’s just math, it’s how discounting works. So every stream of future earnings from a company becomes more valuable when rates drop. Stock prices go up. Bond prices go up (they move inversely to yields). Mortgage rates fall, so people can afford more house, so real estate goes up. Companies borrow cheaply to buy back their own stock, inflating earnings per share and pushing prices higher still. It all compounds on itself. The 40-year bond bull market is the hidden foundation underneath almost every “genius” investment story from 1981 to 2021. It doesn’t mean skill didn’t matter. It doesn’t mean there weren’t great companies built and great fortunes earned through genuine insight. But it does mean the playing field was tilted dramatically in favor of anyone who owned assets — stocks, bonds, real estate, private equity, you name it. The tide was rising, and most boats rose with it. The Bottom, and the TurnIn August 2020, the 10-year Treasury yield hit 0.55%. That was the bottom. The absolute floor of a 79-year journey. In hindsight, it seems almost obvious. Rates cannot go meaningfully below zero in a normal economy for long. And when the pandemic hit, governments and central banks responded with the largest coordinated money printing exercise in history. Trillions in stimulus. Supply chains shattered. Demand bouncing back. The ingredients for inflation were all sitting in the same pot, and nobody wanted to admit it was going to boil. It boiled. Inflation roared back to levels not seen since the 1970s, and the Fed was forced to hike faster than at any point since Volcker himself. The 10-year yield climbed back through 2%, through 3%, through 4%. Today it sits around 4.4% — and the market is no longer pricing in many rate cuts. The conversation has shifted. The era of free money is over. Where We Are Now — and What It Probably MeansThe critical question this chart raises is one that Wall Street has been arguing about since 2022: is this a temporary spike — a brief interruption before yields fall back toward 2% and the old game resumes — or has the 40-year structural bull market in bonds definitively ended? My read, for what it’s worth, is that the weight of evidence points toward the latter. Here’s why. The structural forces that pushed rates down for four decades are either exhausted or running in reverse. Globalization suppressed wages and goods prices for a generation. That era is visibly fracturing under tariffs, friend-shoring, and the great geopolitical decoupling between the US and China. Demographics, which provided cheap young labor and high savings rates across the developed world and in China, are now turning into headwinds — aging populations spend savings rather than accumulate them, and shrinking workforces push wages up. Then there’s the fiscal reality that nobody in Washington seems particularly interested in confronting. The US is running deficits of roughly two trillion dollars a year with no serious political mechanism to stop it. The Treasury has to sell an enormous volume of bonds to fund that gap. During the QE era, the Federal Reserve was a price-insensitive buyer that absorbed that supply and suppressed yields. That buyer has left the building. Private investors now have to absorb all that supply, and private investors have a price — they want to be compensated for the risk. That puts a gravitational pull on yields that didn’t exist a decade ago. Look at where yields have settled — roughly 4 to 4.5%. Notice that this is almost exactly where they were in the 1950s and early 1960s, before the great inflation spiral began. That’s not a coincidence. It may well be that the 0 to 3% world of 2009 to 2021 was the historical anomaly. A return to 4 to 5% isn’t a crisis — it’s a return to something like normal. What This Means for Stocks and the Bubbles That Got InflatedThis is the part that should make anyone with a serious investment portfolio sit up and think carefully. The four-decade bond bull market didn’t just make bonds and houses expensive — it inflated the largest collection of asset bubbles in human history, simultaneously, across almost every asset class. Equities. Private equity. Venture capital. Commercial real estate. High-yield credit. They all floated up on the same tide of cheap money and falling discount rates. The S&P 500’s price-to-earnings ratio expanded enormously over that period. Part of that was genuine — companies got better, technology created real value, margins improved. But a significant portion of it was simply the math of falling discount rates making future earnings worth more today. When rates rise, that math reverses. The same earnings stream, discounted at a higher rate, is worth less. There’s also the competition argument, which is simple but powerful. For most of the 2010s, cash and bonds paid you essentially nothing. A savings account was a place for your money to quietly lose value to inflation. In that world, you had to own equities — there was no alternative. Today, you can earn 4.4% on a 10-year Treasury with zero credit risk. That’s real competition for equity capital that didn’t exist for over a decade. Investors have a genuine choice now, and that changes how they price risk assets. The bubble-breaking mechanism in a higher-rate world isn’t always a dramatic crash. Sometimes it is — but often it’s slower and more insidious. Liquidity gradually dries up. Marginal buyers disappear. The assets that rose the most on cheap money — long-duration growth stocks, unprofitable tech companies, speculative crypto, private equity bought at 15x EBITDA — face the harshest adjustment. Commercial real estate is quietly working through a painful reckoning right now, having borrowed at 3% and facing refinancing at 7%. That process has years left to run. The Bottom LineThat 100-year chart isn’t just financial history. It’s the operating system that the entire modern economy ran on — and it just got an update that most investors’ mental models haven’t absorbed yet. We are almost certainly not going back to 15% yields. This isn’t 1981. But we are also probably not going back to 1%. The world of sustained 4 to 5% rates is one where the valuation premium in equities gradually compresses, where government debt service costs become an increasingly ugly fiscal story, and where the “buy everything” playbook of the last decade simply doesn’t work the same way. The strategies, assumptions, and confidence that most investors built up over the past 40 years were forged in a very specific interest rate environment. That environment has changed. History suggests that when these secular turning points occur, the adjustment process is longer and more painful — and more gradual — than most people initially expect. The tide went out. It may not be coming back. As always, none of this is financial advice — just one person’s attempt to make sense of a complicated world. New To TradersPro? Performance
|
Minggu, 29 Maret 2026
The Tide Went Out. It's Not Coming Back.
Langganan:
Posting Komentar (Atom)
Tidak ada komentar:
Posting Komentar