Follow a Proven Stock Trading Plan
Get The Plan
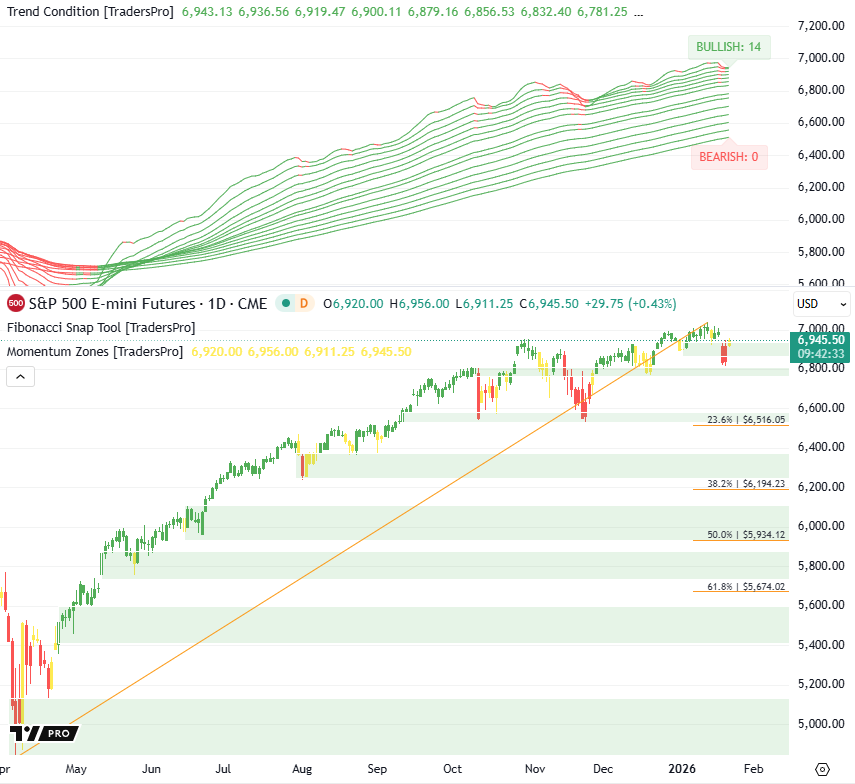
Market Overview:
S&P 500 futures bounce after a sharp decline, but the character of the move still leans defensive. Price is recovering off momentum support, yet the broader structure shows signs of fragility rather than renewed strength. Sellers made meaningful progress yesterday, and today’s reaction looks more like stabilization than trend continuation.
Bullish/Bearish Trend Analysis
Trend Condition: Bullish Trends: 14 Bearish Trends: 0
Trend Condition: Bullish but weakening internally
Explanation: All EMAs remain bullish, yet the upper band has started to bend and lose slope after yesterday’s breakdown. When slope softens while price lingers near support, rallies become more selective, and the trend becomes vulnerable to rotation rather than broad follow-through.
Trend Structure: softening, flattening at the top end
Implication: The EMA structure is still wide and positive but showing early compression signs. When the top of the stack loses angle, it often signals momentum exhaustion. A pullback phase can appear even while the formal condition remains bullish.
Probability Outlook:
Continuation: 55% — because the stack remains fully bullish.
Consolidation / Pullback: 45% — because price cracked trendline support, and slope loss is creeping into the upper EMAs.
Charts by TradingView
Follow a Proven Stock Trading Plan
Get The Plan
Price Action and Momentum Zones
Current Price and Change:
S&P 500 Futures trade at 6,945.50, up 29.75 points (+0.43%).
Market Behavior:
Price reclaimed yesterday’s breakdown level but has not pushed into a higher high. Buyers defended the momentum zone cleanly, but they have not demonstrated aggression. Without decisive follow-through, today’s bounce may serve as a pause rather than a reversal.
Momentum Zones:
Price sits inside the upper momentum layer. Strong if reclaimed decisively, but vulnerable if rejected. A close back below this region reopens the path toward 6,850–6,820.
Fib Retracement Levels
Current Position Relative to Levels:
Price remains above the 23.6% Fib retracement and comfortably above deeper corrective levels.
Analysis:
The shallow Fib band continues to hold, consistent with an intact but slowing trend. If sellers return and force a close beneath yesterday’s lows, the move typically accelerates toward the 23.6% zone—a common target in maturing trends.
Overall Market Interpretation:
The trend is still bullish, but momentum is shifting. Yesterday’s breakdown was significant enough to reset sentiment, and today’s bounce is not yet a reclaim of leadership. Bulls need decisive strength above 6,960–6,980 to regain control; otherwise, a consolidation develops.
Follow a Proven Stock Trading Plan
Get The Plan
Daily Trade Idea
Performance
Understand Risk
Tidak ada komentar:
Posting Komentar