
Happy Thriving Thursday!
Last week, the market was up 3 days out of 5 trading days. And, then this week has been up two. The days start out positive and end a little lower. The result is the S&P or SPY ETF has been flat for 3 weeks with little gain. It could be that it is getting tired and rather than a large pullback it is going to remain flat for a while.
Am going to call Thursday “SPY Day”. Each Thursday, I will focus on what SPY is doing, with the hope it will help give us a clue about the market’s upcoming moves.
SPY or the SPDR S&P 500 trust is an exchange-traded fund which trades on the NYSE Arca under the symbol SPY. SPDR is an acronym for the Standard & Poor's Depositary Receipts, the former name of the ETF. It is designed to track the S&P 500 stock market index. This fund is the largest ETF in the world and gives a good overall picture of the market. SPY includes shares from the top 500 companies.
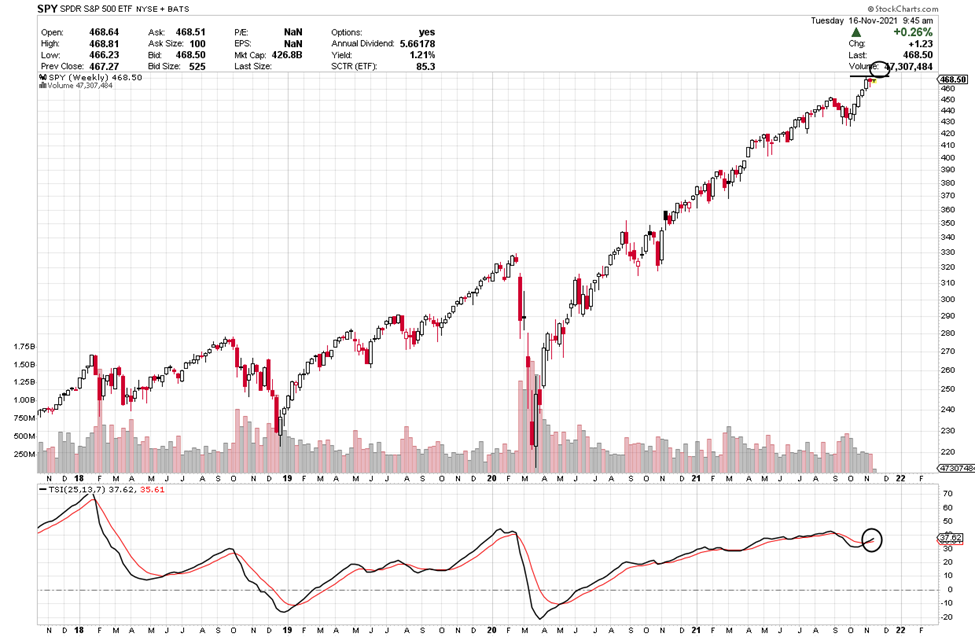
The chart of the S&P below is a weekly chart with a TSI indicator at the bottom. The description coming up next explains how to use the TSI.
True Strength Indicator
The True Strength Index (TSI) is an oscillator that fluctuates between positive and negative territory. As with many momentum oscillators, the centerline defines the overall bias. The bulls have the momentum edge when TSI is positive, and the bears have the edge when it's negative. As with MACD, a signal line can be applied to identify upturns and downturns. Signal line crossovers are, however, quite frequent and require further filtering with other techniques. Chartists can also look for bullish and bearish divergences to anticipate trend reversals; however, keep in mind that divergences can be misleading in a strong trend.
TSI is somewhat unique because it tracks the underlying price quite well. In other words, the oscillator can capture a sustained move in one direction or the other. The peaks and troughs in the oscillator often match the peaks and troughs in price. In this regard, chartists can draw trend lines and mark support/resistance levels using TSI. Line breaks as well as line crosses can then be used to generate signals.

Plain and Simple
On the line indicator at the bottom of the chart, look how the black line dipped down, crossed down below the red line but has now flattened out and has now turned back up. This last week it crossed up. The last TSI crossed down was in February 2020 with Covid, so a breach was meaningful but now it appears as if the drop has finished, it formed a base and now has turned up showing strength. The candles furthest to the right are the most recent weeks’ candles. This week’s candle is still black as I type and is sitting right at overhead resistance (like a ceiling).
TSI Buy Signal
Each candle on the chart represents price movement over one day. For months, the SPY has broken out and has been moving up. The TSI line dug into its signal line, created white space between the lines, dropping well below and has now flattened out and has headed up and just crossed back up. Price is close to all-time highs.
Price needs to move above the overhead line to consider a trade. Support is like a floor and resistance is like a ceiling, and price needs rise above that level.
Below I will discuss how things can be traded if the SPY continues its upward climb.
Check out the profit potential of option trading versus buying stock. Big difference!!!
SPY is a well-rounded ETF, offering exposure to the price moves of 500 equities. Options Trade Both Directions (depending on what happens)
To buy shares of SPY today would cost approximately $469 per share (as I write this on Tuesday), but I am suggesting it may be getting tired. I have no way to know if it will break above and go down. After 5 up weeks, it seems tired and could be ready to catch its breath. Based on this, I suggest we continue to take a break or wait until it shows where it is going next.
Option trading offers the potential of a lower initial investment and higher percentage gain. Let’s take a look and compare.
You buy call options if you expect price to go up and put options if you feel price is going to drop.
Wait until it moves above 470 before considering a Call trade.
If you bought 2 shares of SPY at $470, you would invest a total of $940. Now, if SPY were to move above $470 and say, moves higher to 475, it would profit approximately $5 per share or $10 for the two shares or 1%. Not a very exciting profit.
If it drops through support at $468 to $450, you lose $18 per share or $36 for the two shares if it stopped at that level or even more if it kept dropping.
As I type this numbers are rising, so the figures below are strictly examples as I type.
Now to compare. If you bought one Call option contract covering 100 shares of stock with a Dec 3rd (Dec wk1) expiration date for the $475 strike (if price rises above 470 before entry), the premium would be approximately $3.82 per share or $382 for the contract. If price increased the expected $5 over the next few weeks, the option premium would increase approximately $3 to $6.82. This is a gain of $3 per share or $300 for the 100-share contract or 79% over a short period of time.
This would be $300 profit on an investment of $382. Pretty good over a short period of time.
Option trading is truly unique in its ability to give traders the opportunity to trade an equity’s price move in either direction.
These types of trades are what can bring life-changing financial gains.
I want to stress, when you trade options, you can close the trade anywhere along the line to take profit (or loss). You don’t have to wait until it hits the target or until expiration day.
You also want to wait for the indicator confirmation and don’t jump-the-gun with an early entry.
Trading options can be a win, win, win opportunity. Options often offer a smaller overall investment, covering more shares of stock and potential for greater profits.
What’s Next? I Can Hardly Wait!
Keep an eye on your inbox and I will keep sharing what I have my eye on. If you want to get deeper into how I find these winners, be sure to check out the programs in the banners in this message to learn more about options.
I love teaching and write my strategy books as clear as I write these emails. I try to think of the questions you’ll ask before you ask them. Sign up and join me in the profit potential.
Yours for a prosperous future,
Wendy Kirkland

Past trades:
Three weeks ago, we discussed Nov 19th (Nov 21) expiration of strike 465 at 1.85 per share and last week it was at 5.27 per share. This was a gain of 3.42 in two weeks or 184% profit. Today it is at 4.88 – price hasn’t dropped much but it is losing time decay as expiration nears.
Two weeks ago, we studied the Nov 24th (Nov wk 4) expiration of strike 465 at a premium of 2.90. Today the ask is 5.47. This is still a gain of 3.47 or 120% profit. Unless it pops it, it too will start losing time decay as expiration approaches.
Last week, we discussed a November 29th expiration date and a 475 strike with a premium of 1.75. It never reached the level needed to enter the trade and has since lost time decay, bringing the premium down to .99.
See Related Articles on TradeWinsDaily.com
Top Three Market Reversal Signals
Pharmaceutical Company’s Chart Looks Healthy

© 2021 Tradewins Publishing. All rights reserved. | Privacy Policy | Terms and Conditions | Contact Us
The information provided by the newsletters, trading, training and educational products related to various markets (collectively referred to as the "Services") is not customized or personalized to any particular risk profile or tolerance. Nor is the information published by Wendy Kirkland a customized or personalized recommendation to buy, sell, hold, or invest in particular financial products. Past performance is not necessarily indicative of future results. Trading and investing involve substantial risk and is not appropriate for everyone. The actual profit results presented here may vary with the actual profit results presented in other Wendy Kirkland publications due to the different strategies and time frames presented in other publications. Trading on margin carries a high level of risk, and may not be suitable for all investors. Other than the refund policy detailed elsewhere, Wendy Kirkland does not make any guarantee or other promise as to any results that may be obtained from using the Services. Wendy Kirkland disclaims any and all liability for any investment or trading loss sustained by a subscriber. You should trade or invest only "risk capital" - money you can afford to lose. Trading stocks and stock options involves high risk and you can lose the entire principal amount invested or more. There is no guarantee that systems, indicators, or trading signals will result in profits or that they will not produce losses.
Some profit examples are based on hypothetical or simulated trading. This means the trades are not actual trades and instead are hypothetical trades based on real market prices at the time the recommendation is disseminated. No actual money is invested, nor are any trades executed. Hypothetical or simulated performance is not necessarily indicative of future results. Hypothetical performance results have many inherent limitations, some of which are described below. Also, the hypothetical results do not include the costs of subscriptions, commissions, or other fees. Because the trades underlying these examples have not actually been executed, the results may understate or overstate the impact of certain market factors, such as lack of liquidity. Wendy Kirkland makes no representations or warranties that any account will or is likely to achieve profits similar to those shown. No representation is being made that you will achieve profits or the same results as any person providing a testimonial. Testimonials relate to various other products offered by Wendy Kirkland and not the product offered here, but all of these products are based on Wendy Kirkland's system. Performance results of other products described in such testimonials may be materially different from results for the product being offered and may have been achieved before the product being offered was developed.
Results described in testimonials from other products or the product being offered may not be typical or representative of results achieved by other users of such products. No representation is being made that any of the persons who provide testimonials have continued to experience the same level of profitable trading after the date on which the testimonial was provided. In fact, such persons may have experienced losses immediately thereafter or may have experienced losses preceding the period of time referenced in the testimonial. No representation is being made that you will achieve profits or the same results as any person providing a testimonial. Wendy Kirkland's experiences are not typical. Wendy Kirkland is an experienced investor and your results will vary depending on risk tolerance, amount of risk capital utilized, size of trading position, willingness to follow the rules and other factors.

|

Tidak ada komentar:
Posting Komentar