Selasa, 30 Desember 2025

How to Read the Market’s Hidden Signals

Shield

AN OXFORD CLUB PUBLICATION

Loyal reader since October 2020

Liberty Through Wealth

SPONSORED

Rickards: ‘I’m updating my recent prediction’

Phase II Announcement
 

When I first released my "American Birthright" prediction...

I thought this $150 trillion mineral boom would unfold slowly.

But I was dead wrong...

Now the timeline – your chance to make historic wealth through mining investments – has been expedited.

And Phase II of Trump’s mineral boom is set to begin in a matter of days.

Watch my briefing here.

EDITOR'S NOTE

Marc Lichtenfeld has spent decades mastering the art of reading charts - identifying patterns that reveal when fear turns to greed and when stocks are ready to soar.

Now, he's using those same skills to uncover seven small companies set to lead what he calls the biggest technological buildout in American history.

At The AI Supremacy Summit, Marc and Alexander Green revealed how these microcap stocks could deliver 1,500% or more in the months ahead as trillions flow into AI infrastructure.

Click here to watch the replay now!

- Nicole Labra, Senior Managing Editor

THE SHORTEST WAY TO A RICH LIFE

How to Read the Market's Hidden Signals

Marc Lichtenfeld, Chief Income Strategist, The Oxford Club

Marc Lichtenfeld

As the ticker symbols and prices whooshed past me, the traders in my office shouted buy and sell orders at me nonstop throughout the trading day.

I couldn't understand how these traders made sense of the information that flew by us on our screens as they made buy and sell decisions.

This was 25 years ago, when I was a newly minted trading assistant on the trading desk of a small firm, trying to hang on for dear life and figure out what the heck was going on.

A short time later, a friend showed me a book on stock charts, and I was hooked. I'd found my holy grail, I thought. The charts would definitively show me which stocks would be winners and which would be losers… right?

If only it were that simple.

I've been studying and using stock charts and technical analysis for more than two decades.

Newcomers to the concept (including myself) mistakenly think the charts are a crystal ball.

They're not.

But what they're extremely useful for is revealing patterns that have repeated time and time again over the years.

It's fairly simple when you think about it. The stock market measures greed and fear. If a stock is going up, more people are greedy than fearful. The opposite is true when a stock falls.

Charts are a visual representation of those two emotions playing out in the market.

Costco
 
Chemours
 

What technical analysis is best at is helping traders and investors understand their risk and when they can be confident a stock is going to go up, down, or sideways.

SPONSORED

Alex and Marc's Seven Favorite Microcap Stocks

  • One Just Discovered a $37 billion rare earth deposit in Wyoming.
  • A second is working with Apple, Microsoft, Amazon, and 2,300 other customers. It could 20X and still be cheap!
  • Another has seen 23,400% sales growth since 2022 and just signed an $11.9 billion deal with OpenAI. (Ticker reveled during the event)

Get details on all seven in the biggest event of the year, The Micro Mag 7 Summit.

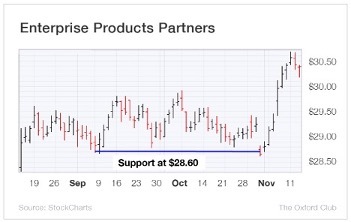
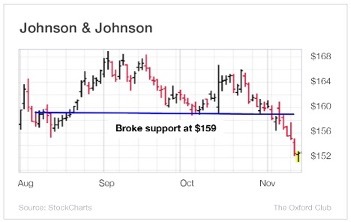
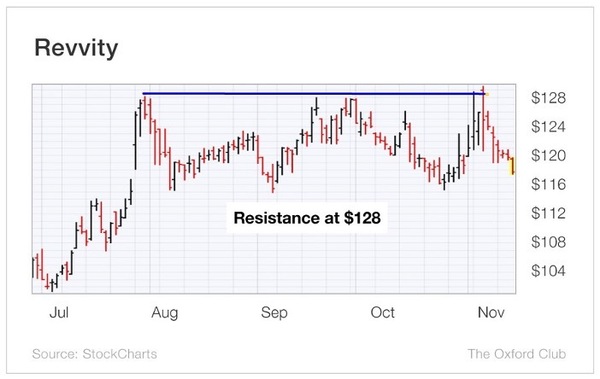
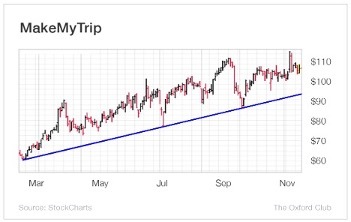
One of the easiest concepts to understand is support and resistance. Support is a price level that a stock doesn't drop below. It acts like a floor. For whatever reason, whenever the stock gets to that area, it stops falling as buyers step in.

Take a look below at the chart of Enterprise Products Partners (NYSE: EPD). You can see that each time the stock dipped to about $28.60, it rebounded. We don't know (or even care that much) why buyers stepped in at that level, but they did, and the stock eventually moved higher.

So, in September or October of last year, if the stock was trading at $29, you could've bought it and felt confident that if it fell meaningfully below $28.60, you would've known it was time to sell and gotten out with a small loss instead of hoping the stock would rebound.

Enterprise Products Partners
 

Here's an example of broken support - when buyers stopped buying at the support level.

Johnson & Johnson
 

This is what I mean when I say to use support to understand your risk. Johnson & Johnson (NYSE: JNJ) had a similar pattern, with support around $159. Each time the stock fell to $159, it rebounded.

But then, at the start of November, it broke below $159 and kept going. Once it moved down to $157 or so, traders knew that the stock was unlikely to bounce back up in the near term, so the buying activity at $159 dried up.

Resistance is the same as support, but in the opposite direction. It's a ceiling on a stock. For whatever reason, at a certain price level, the sellers overwhelm the buyers and the stock falls.

So if you were interested in buying Revvity (NYSE: RVTY) and it was trading at $126, you'd probably want to wait until it broke $128 so you'd know the sellers weren't going to dump shares and push the stock back down like they had before.

Revvity
 

One last note about support and resistance is that they don't have to be flat lines at one price. Support and resistance can rise or fall in what's known as a trend line.

You can see on this chart of the travel company MakeMyTrip (Nasdaq: MMYT) that the stock was in an uptrend for over eight months, bouncing along a trend line that just kept moving higher.

MakeMyTrip
 

When a stock comes close to or hits the trend line, the trend line often acts as support and the stock rises. If the stock breaks below the trend line, we know the uptrend is likely over and that we should consider exiting the position.

Think of support and resistance as floors and ceilings for stocks. Once they are broken, you know things have changed. And remember, stock charts and other analytical tools are not going to be right 100% of the time, but they shine a light on significant changes in investor psychology.

If used properly, the charts will help you minimize your losses and optimize your entry points.

Good investing,

Marc

This secret stock is set to bring 50,000 new jobs to America with a deal involving Apple and $10 billion

BUILD AND PROTECT YOUR WEALTH

Costco Manager Reveals a 3-Minute Secret That Changed Alexander Green's Life

How to Make Millions by Doing Nothing

Billionaires Are Quietly Buying These Overlooked American Stocks

So Close, But Still Not Enough, Can You Help?

SPONSORED

Will THIS Be the Dot-Com-Boom 2.0?

ODot-Com-Boom 2.0
 

Are you ready for what could be the: The Dot-Com-Boom 2.0?

Alexander Green (the man who bought Apple at $1) says we're racing headfirst into a rare market event - that each time, without fail - has minted a new class of millionaires...

Helping investors collect lifetime returns of 10-times, 50-times, even 100-times their investment.

Now, the same kind of opportunity - is rapidly unfolding.

And Alexander Green is giving all the details on how to profit.

Including his #1 Stock-Pick for 2025 - revealed 100% FREE.

>> Click Here to Watch: "The 2025 Millionaire-Maker" Event <<

Tidak ada komentar:

Posting Komentar