PCE inflation remains sticky … why gold wins regardless of where inflation goes … gold has crushed stocks since 2000 … the “government debt” tailwind This morning’s Personal Consumption Expenditure (PCE) Price Index report largely matched forecasts.
Core PCE, the Fed’s preferred inflation gauge, increased 0.2% month-over-month. This was in line with the Dow Jones estimate.
On an annual basis, it climbed 2.8%, which was 0.1 percentage point above expectations.
The report also included the latest statistics on income and spending. Here’s CNBC with those details: Personal income increased 0.3% on the month, matching the estimate, while spending rose just 0.2%, below the 0.4% estimate and off March’s downwardly revised 0.7%.
Adjusted for inflation, the spending numbers showed a 0.1% decline, due in large part to a 0.4% decrease in spending on goods and just a 0.1% rise in services expenditures. How do interpret all this?
Well, first and fortunately, the report wasn’t “hotter than expected” sending the markets into a tailspin. As I write, the markets are mixed, and the Nasdaq is down about 1%, but frankly, it could be worse. That’s the good news.
The bad news is that this morning’s data continue to show “sticky” inflation. This was the third straight month of Core PCE inflation stuck at 2.8%. And in January, it was 2.9%.
So, while the data weren’t unexpectedly hot, neither were they unexpectedly cool, offering the Fed an airtight case to begin cutting rates in September. This means that over the coming weeks, we’ll likely hear the various Fed presidents echo the familiar refrain of, “more data are needed.”
Bottom line: We remain in limbo.
Now, with stocks looking for direction in the wake of this report, let’s shift our gaze.
Here in the Digest, we’ve been gold bulls for a long time. And today’s macro set-up is increasingly attractive for the yellow metal, regardless of what happens with inflation, the Fed, and rate cuts.
Let’s look at why. ADVERTISEMENT  Elon Musk calls it a “license to print money” because it’s critical for the global economy.
But could Musk lock up the world’s largest supply of this critical metal — worth as much as $1 TRILLION dollars?
All he would have to do is buy one company... for a fraction of what he paid for Twitter.
Even if Musk decides to ignore this opportunity, you shouldn’t.
Get the full story The bullish cases for goldLet’s say that inflation falls back in line and resumes easing exactly as the Fed wants. This prompts the first rate cut later this year.
Historically, this would be bullish for gold because lower interest rates decrease the appeal of interest-paying assets that appear more attractive than gold in a high-yield environment.
So, how might gold perform if/when the Fed begins cutting?
Here’s Matt Weller, Head of Market Research at City Index: Over the past 40+ years of easing cycles, here are some conclusions that we can draw based on this analysis:
Gold prices have seen a wide range of 1-year returns heading into a Fed rate cut, spanning from +11% to -39%.
Post-rate-cut returns have been volatile as well, spanning from -10% to +39%.
On average, Gold has…risen by 11% in the year after.
Gold has risen one year after the first Fed rate cut of a new cycle six of the past seven times. So far, so good. What’s the case for gold in a higher-for-longer interest rate environment? Having just made the case for gold if/when the Fed cuts rates, it seems inconsistent that we’d now make the case for gold if/when the Fed doesn’t cut rates.
But consider why the Fed might have to hold rates at elevated levels – namely, persistent inflation.
Historically, gold is an effective storehouse of value during inflation, helping investors maintain their wealth as fiat currencies depreciate.
But let’s put this assumption to the test.
If gold is effective as a wealth preserver, then the ratio of gold’s price to the price of another similar hard asset should remain consistent over many decades.
Well, that’s exactly what we find when we compare gold and home prices.
The price of gold in 1920 was roughly $21 per ounce. As I write on Friday, it’s worth $2,363. Let’s call that a 110X price increase.
Meanwhile, in 1920, the price of a typical U.S. home was roughly $5,000. The Fed reports that in Q1 of this year, the median home price was nearly $421,000. That’s an 83X gain.
So, relative to homes, not only has gold maintained its value over the last 100+ years, but it’s become more valuable.
Meanwhile, the U.S. dollar has lost 94% of its purchasing power since 1920.
Here’s the website In2013Dollars which crunches the numbers on how inflation has impacted the U.S. dollar’s purchasing power over the years: $100 in 1920 is equivalent in purchasing power to about $1,567.74 today, an increase of $1,467.74 over 104 years…
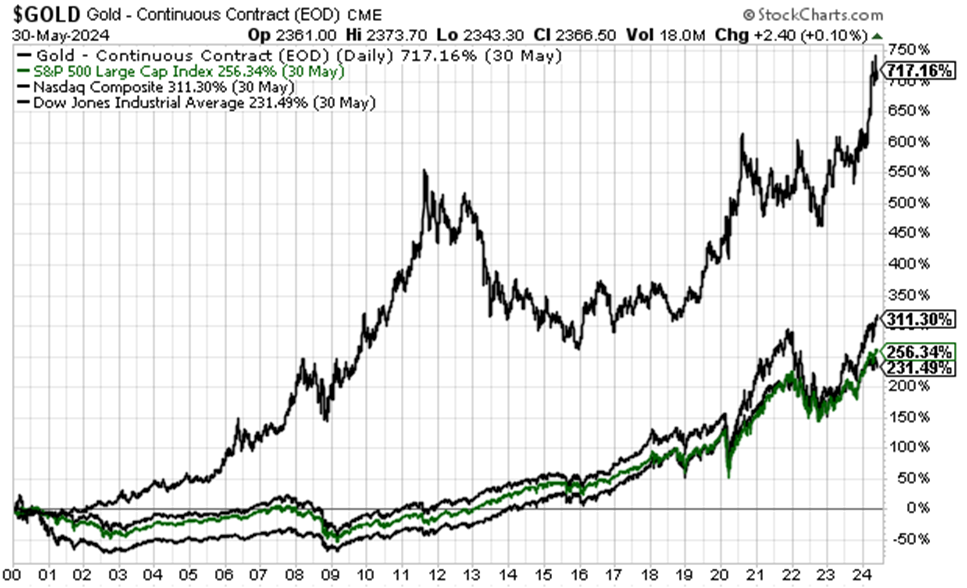
A dollar today only buys 6.379% of what it could buy back then. By the way, if your kneejerk reaction to this is, “Fine, Jeff, but I’d rather put my money in stocks than gold,” well, just be aware that since January 1st of 2000, gold has more than 2X’d the Nasdaq and almost 3X’d the S&P and Dow.  ADVERTISEMENT  One TradeSmith service has delivered a 95% success rate going back to 2021…
Giving readers the chance to collect consistent payouts in all markets.
And now, Keith believes it could help those with large portfolios make six figures in 6-12 months – starting immediately.
Right now, you can join for 60% off the retail price.
The only catch: You must hurry. This deal expires June 4th at midnight.
Details here. Let’s add one more reason why gold is very attractive right now – U.S. government debt and the fiscal deficitWhen our government needs money, it either taxes its citizens or it borrows.
Borrowing takes the form of security issuance – think government bills, notes, and bonds issued by the Treasury.
Now, as we’ve profiled many times here in the Digest, our government is on an unsustainable spending path. The amount of money it generates from taxes is woefully insufficient to meet its promised spending obligations.
For example, last year, the federal government collected nearly $4.5 trillion in tax revenue. However, total federal outlays clocked in at $6.1 trillion.
This shortfall would suggest the government would need to lean more heavily on borrowing, meaning flooding the Treasuries market with new security issuance.
Is that happening?
See for yourself.
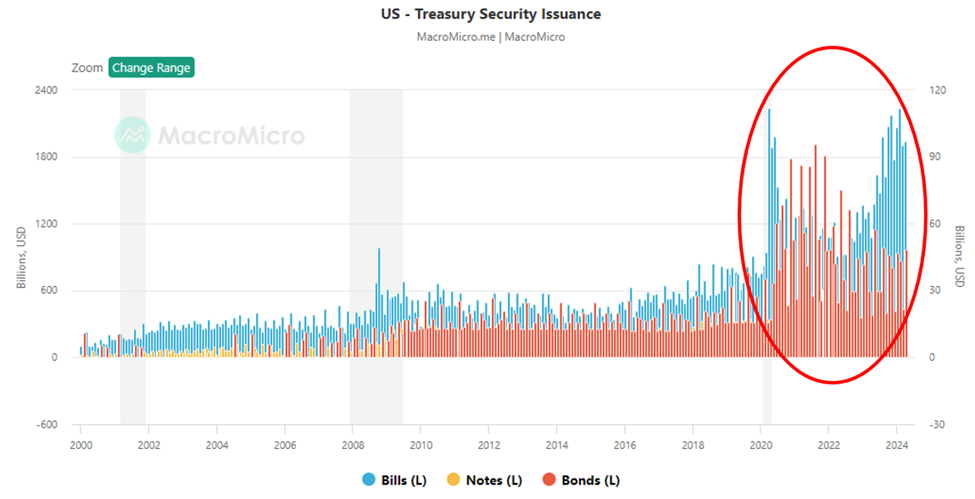
Below, we look at U.S. Treasury Security issuance beginning in the year 2000. Notice how it’s a slow creep higher until 2020, when things explode.  Source: MacroMicro ADVERTISEMENT  Maybe you’ve seen Goldman Sachs’s forecast that the $15.7 trillion AI revolution will impact 300 million jobs. But Elon Musk’s “AI 2.0” is already forcing organizations to ramp up those estimates. Now McKinsey analysts say it could leave 800 million unemployed, as Wired.com says 70% of occupations could be replaced. Where could you and your family stand in all this?
Get details here Now, the question is “with this flood of securities hitting the market, is there enough demand for them?” Let’s rewind to The Wall Street Journal from last fall: Foreigners no longer have an insatiable appetite for U.S. government debt. That’s bad news for Washington.
The U.S. Treasury market is in the midst of major supply and demand changes. The Federal Reserve is shedding its portfolio at a rate of about $60 billion a month.
Overseas buyers who were once important sources of demand—China and Japan in particular—have become less reliable lately.
Meanwhile, supply has exploded. The U.S. Treasury has issued a net $2 trillion in new debt this year, a record when excluding the pandemic borrowing spree of 2020.
“U.S. issuance is way up, and foreign demand hasn’t gone up,” said Brad Setser, senior fellow at the Council on Foreign Relations. “And in some key categories—notably Japan and China—they don’t seem likely to be net buyers going forward.” Now, let’s be clear: There will always be demand for U.S securities in the sense that someone will buy them. The better question is “buy them at what price?”
This matters because of the inverse relationship between bond prices and bond yields. As bond prices go lower (the Treasury is forced to offer discounts), bond yields go higher. And higher bond yields aren’t good for the Federal government's debt service (or stocks, for that matter).
We saw this dynamic play out earlier this week as the Treasury issued a new batch of securities.
Here’s CNBC’s headline on Tuesday: “10-year Treasury yield rises above 4.5% following weak auction”
And here’s MarketWatch on Wednesday: “Treasury's $44 billion sale of 7-year notes is met with poor demand”
Poor demand means lower prices… which means higher yields… which means the interest our government must pay to its lenders continues climbing.
Here’s the non-partisan thinktank, the Peter G. Peterson Foundation: As interest rates on U.S. Treasury securities rise, so too will the federal government’s borrowing costs.
The United States was able to borrow cheaply to respond to the pandemic because interest rates were historically low. However, as the Federal Reserve increased the federal funds rate, short-term rates on Treasury securities rose as well — making some federal borrowing more expensive.
Expectations about short-term rates and inflation have already pushed up longer-term rates as well.
In February, the Congressional Budget Office (CBO) projected that annual net interest costs would total $870 billion in 2024 and almost double over the upcoming decade.
That is equivalent to soaring from $951 billion in 2025 to $1.6 trillion in 2034 and summing to $12.4 trillion over that period.
However, if inflation is higher than CBO’s projections and if the Fed holds interest rates longer than the agency projected, such costs may rise even faster than anticipated. Bringing it back to gold, here’s Reuters: The unchecked growth of U.S. government debt is gaining more attention as interest rate payments also take a larger bite of the government's budget - in some months exceeding spending on national defense.
This worsening trajectory has boosted demand for bitcoin and gold, which are often used as a hedge against inflation and the depreciating purchasing power of the U.S. currency.
“Concerns about the U.S. debt cycle, devaluation of money - and fiat money in particular - does drive the story and the narrative,” said Brad Bechtel, global head of FX at Jefferies. We’re beginning to run long, but there’s yet another tailwind we haven’t discussed today – record gold buying from global central banks.
Our macro expert Eric Fry detailed this in his May issue of Investment Report. Here’s his quick takeaway: According to the World Gold Council, global central banks “doubled down” on gold demand by setting a new first-quarter buying record.
In total, they purchased 290 tonnes, which was the strongest start to any year on record. If you’re an Investment Report subscriber, click here to log in to read the May issue. If you’d like to learn more about joining Eric in Investment Report, click here.
Bottom line: Regardless of what happens with inflation and the Fed’s rate policy in our near future, you want some gold in your portfolio today. Have a good evening, Jeff Remsburg |
Tidak ada komentar:
Posting Komentar