
Happy Thankful Tuesday!
I am excited to share that you don’t need special education or to sit in front of the computer all day to trade options. It can be easily learned if you are interested in spending an hour or so a week earning money in what could be considered “renting” stocks for a short period of time.
This is why I show you the details about an equity’s symbol and pattern each week.
I am typing this on Sunday, before the new week starts. Last week, the Dow was down 4 days out of 5. This is the opposite of the Nasdaq that was up 4 days. Talk of inflation seems to be the main catalyst for the Dow’s drop, while technology related stocks climb.
For the updates on previously discussed symbols, please scroll down.
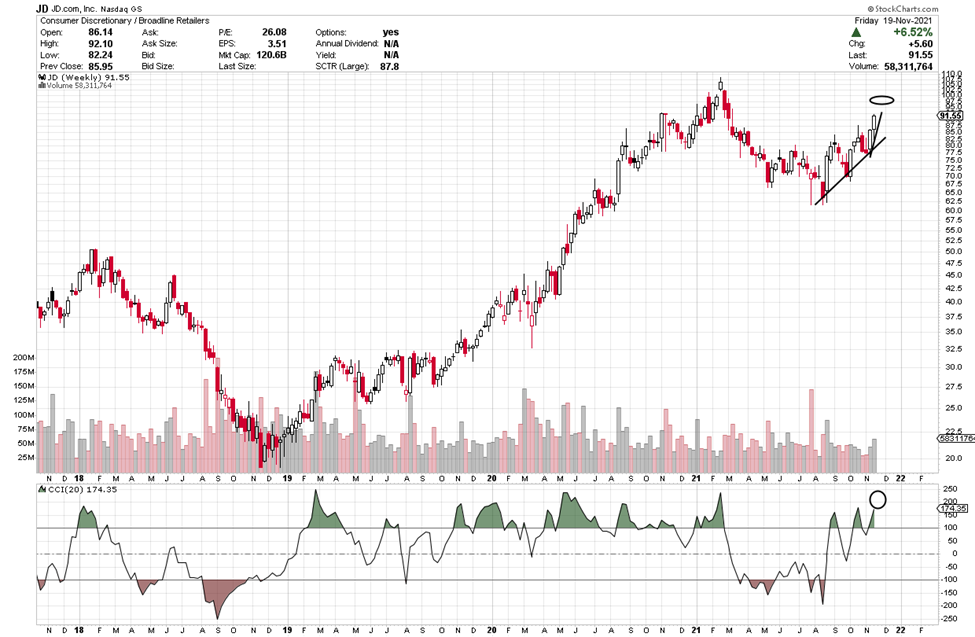
For today’s Trade of the Day, we will be looking at JD.com., symbol (JD)
Before analyzing JD’s chart, let’s take a closer look at the company and its services.
JD.com, Inc. operates as an e-commerce company and retail infrastructure service provider in the People's Republic of China. It operates in two segments, JD Retail and New Businesses. The company offers home appliances; mobile handsets and other digital products; desktop, laptop, and other computers, as well as printers and other office equipment; furniture and household goods; apparel; cosmetics, personal care items, and pet products; women's shoes, bags, jewelry, and luxury goods; men's shoes, sports gears, and fitness equipment; automobiles and accessories; maternal and childcare products, toys, and musical instruments; and food, beverage, and fresh produce.
The company has strategic cooperation agreement with Tencent Holdings Limited. JD.com, Inc. was incorporated in 2006 and is headquartered in Beijing, China.
Each candle on the chart represents price movement over a 5-day (week) period. The indicator at the bottom of the chart is a Channel Commodity Index (CCI).
I drew a line below the candles, if price stays above that line, the upward trend should continue. Watch for a continued rise toward its target.

A cross down through the CCI zero or -100 line is bearish, in that it is suggesting price has gone from bearish to even more bearish. A cross up through the zero line and a cross through 100, suggests price is bullish. If you want to learn more about the CCI, you can read through the short section below or you can scroll down to the alert signal.
Channel Commodity Index
A cross up and over the CCI -100 or the zero line can issue an entry signal as it moves from being bearish to bullish. A rise toward 100 is a continuation of that bullishness. Up through the 100 line creates a green fin of bullishness, until it drops back down through the 100-line.
Also, a pullback and then, as it heads back up is another bullish indicator.
A break below the zero line means it has gone from bullish to bearish and a drop below -100 suggests even more bearishness.
The Commodity Channel Index (CCI) is a versatile indicator that can be used to identify a new trend or warn of extreme conditions. Originally, it was developed to identify cyclical turns in commodities, but the indicator can be successfully applied to indices, ETFs, stocks and other securities. In general, CCI measures the current price level relative to an average price level over a given period. CCI is relatively high when prices are far above their average but is relatively low when prices are far below their average. In this manner, CCI can be used to identify overbought and oversold levels or breaks from one level to another.
Check Out How This Rise in Price Could Pay Out Big Time
JD is bullish as it rises further above the 100 line. This week’s candle is apt to continue its upward movement that could take it higher. We are looking for a continued rise above $92 before considering entry and then higher. The target is $95.
If you find that you like the CCI Indicator as an easy-to-read indicator, it is included in the 5-Star Academy educational program which includes a chatroom where I am during the day to do live teaching sessions on M-W-F and to answer questions during the day. It is an incredibly supportive community.
Potential Profit Play for JD
If JD’s price continues to move up, you could consider a Call trade. I am writing this on Sunday, if price continues to rise above 92 when you receive this on Tuesday, you could consider a call option trade. We are expecting the CCI indicator to continue rising further above the 100 line.
Price is currently at approximately $92 as I write over the weekend and is expected to continue heading up to perhaps, hit the target of $95 and then higher.
If price doesn’t stay above $92, don’t consider a trade.
If the CCI line stays above the 100 line and then, continues up, price will continue its current uptrend and continue to rise. We will keep an eye on it over the course of the next few weeks.
The short-term price target for JD is $95 and, perhaps, higher.
To buy shares of JD, Inc. (JD) stock today, it would cost approximately $92 per share.
Option trading offers the potential of a lower initial investment and higher percentage gain. It is like renting stock versus buying out right. Let’s take a look.
If you bought 5 shares of JD at $92 total investment $460 and it increased in price to $95, it would result in a profit of $15 for the 5 shares or an 5.4% gain.
If you bought one Call option contract covering 100 shares of JD’s stock with a Dec 10 (Dec wk 2) expiration date for the 95 strike, the premium would be approximately $2.42 per share or a total of $242 for the contract of 100 shares. If price increased the expected $3 over the next few weeks to $95 target, the premium would increase approximately $2 to $4.42. This is a gain of $200 on your $242 investment or 83% profit. That would be a nice trade!
It is exciting to make money if price rises or falls.
I want to remind you that you can sell to close and take profit any time along the line before the expiration date. You don’t have to hold the contract until expiration.
Options often offer a smaller overall investment, covering more shares of stock and potential for greater profits. This is like renting stocks versus having to pay full price to buy.
This said, if you are having any kind of trouble taking advantage of these trades, we don't want you to miss out. I have put together programs that help traders just like you access the potential profits that options provide. Be sure to check out the programs (like 5-Star Academy mentioned earlier) shared in this email and we will make it easy for you to get your share.
I love to trade, and I love to teach. It is my thing.
Yours for a prosperous future,
Wendy Kirkland
PS-I have created this daily letter to help you see the great potential you can realize by trading options. Being able to recognize these set ups are a key first step in generating wealth with options. Once you are in a trade, there is a huge range of tools that can be used to manage the many possibilities that can present themselves. If you are interested in learning how to apply these tools and increase the potential of each trade, click here to learn more.

Previous Equities discuss:
Two weeks ago, we talked about NIO with an expiration of Nov 26th, a strike of 50 and a premium of .75. Tuesday, the market continued its pullback that started Monday and there would have been no trade.
Last week, we discussed SHOP with an expiration of Dec 3rd (Dec wk 1) for a 1,700 strike and a premium of approx. $64. Premium on Tuesday was lower an in the $39 range. On Friday, it rose in the morning to $68.70. A quick 79% gain, and then, by the afternoon, it was back near $39. This was a more expensive equity to trade and wasn’t right for every account.
See Related Articles on TradeWinsDaily.com
E-Commerce Company Climbs Higher
Aerospace Company Launches New Flight Pattern
Chart of the Week: PayPal Holdings (PYPL)
© 2021 Tradewins Publishing. All rights reserved. | Privacy Policy | Terms and Conditions | Contact Us
The information provided by the newsletters, trading, training and educational products related to various markets (collectively referred to as the "Services") is not customized or personalized to any particular risk profile or tolerance. Nor is the information published by Wendy Kirkland a customized or personalized recommendation to buy, sell, hold, or invest in particular financial products. Past performance is not necessarily indicative of future results. Trading and investing involve substantial risk and is not appropriate for everyone. The actual profit results presented here may vary with the actual profit results presented in other Wendy Kirkland publications due to the different strategies and time frames presented in other publications. Trading on margin carries a high level of risk, and may not be suitable for all investors. Other than the refund policy detailed elsewhere, Wendy Kirkland does not make any guarantee or other promise as to any results that may be obtained from using the Services. Wendy Kirkland disclaims any and all liability for any investment or trading loss sustained by a subscriber. You should trade or invest only "risk capital" - money you can afford to lose. Trading stocks and stock options involves high risk and you can lose the entire principal amount invested or more. There is no guarantee that systems, indicators, or trading signals will result in profits or that they will not produce losses.
Some profit examples are based on hypothetical or simulated trading. This means the trades are not actual trades and instead are hypothetical trades based on real market prices at the time the recommendation is disseminated. No actual money is invested, nor are any trades executed. Hypothetical or simulated performance is not necessarily indicative of future results. Hypothetical performance results have many inherent limitations, some of which are described below. Also, the hypothetical results do not include the costs of subscriptions, commissions, or other fees. Because the trades underlying these examples have not actually been executed, the results may understate or overstate the impact of certain market factors, such as lack of liquidity. Wendy Kirkland makes no representations or warranties that any account will or is likely to achieve profits similar to those shown. No representation is being made that you will achieve profits or the same results as any person providing a testimonial. Testimonials relate to various other products offered by Wendy Kirkland and not the product offered here, but all of these products are based on Wendy Kirkland's system. Performance results of other products described in such testimonials may be materially different from results for the product being offered and may have been achieved before the product being offered was developed.
Results described in testimonials from other products or the product being offered may not be typical or representative of results achieved by other users of such products. No representation is being made that any of the persons who provide testimonials have continued to experience the same level of profitable trading after the date on which the testimonial was provided. In fact, such persons may have experienced losses immediately thereafter or may have experienced losses preceding the period of time referenced in the testimonial. No representation is being made that you will achieve profits or the same results as any person providing a testimonial. Wendy Kirkland's experiences are not typical. Wendy Kirkland is an experienced investor and your results will vary depending on risk tolerance, amount of risk capital utilized, size of trading position, willingness to follow the rules and other factors.
|
Tidak ada komentar:
Posting Komentar