
Happy Fabulous Friday!
I teach everyday people (like me) to trade options. I do my best to write in an understandable way as if we are talking over the kitchen table.
Bullish uptrend continues. Last week, the market was up 2 days out of 5. The Dow headed up for a second day this week. The market is trying to recover after a modest pullback last week.
For today’s Trade of the Day, we will be looking at Boeing Company, Inc., which is a Dow listed company. Symbol (BA).
The Boeing Company, together with its subsidiaries, designs, develops, manufactures, sales, services, and supports commercial jetliners, military aircraft, satellites, missile defense, human space flight and launch systems, and services worldwide.
The company was founded in 1916 and is based in Chicago, Illinois.
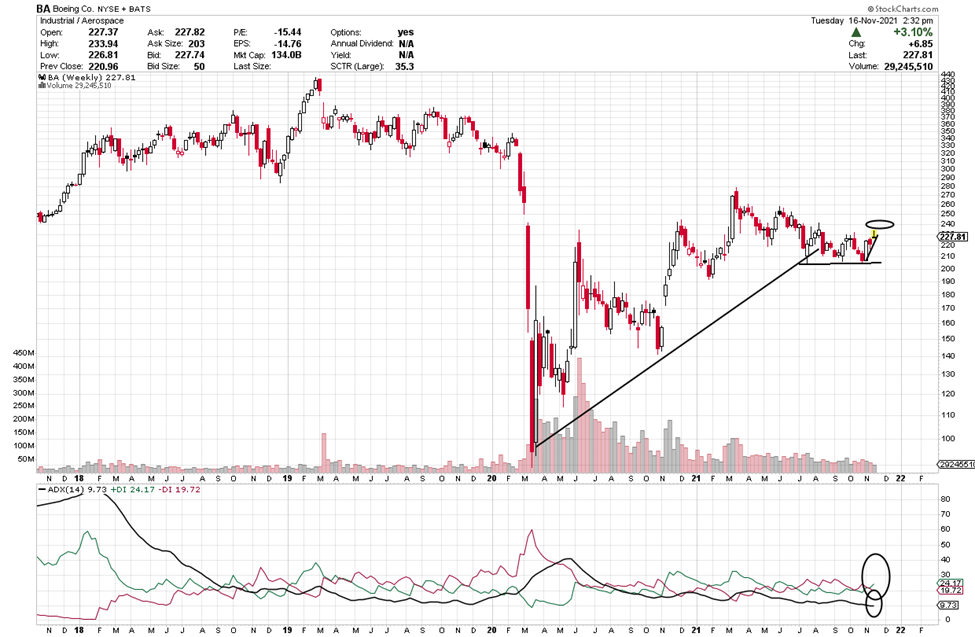
Let’s take a look at BA’s weekly chart.
The ADX +DI (green line) is above the -DI and if it keeps heading up, the ADX line will turn up again. As long as the +DI is above the -DI, price should rise. Green above red is an indication of strength. When the +DI is bullish and the ADX turns up, it shows strength. If you want to learn more about ADX, read on or, if not, scroll down to the alert.
Average Direction Index (ADX) – Strength Indicator
The Average Directional Index consists of 3 lines: Green, Red and Black.
Green = +DI (Bullish)
Red = -DI (Bearish)
Black = ADX Strength Line
The DI line that is on top is in control. If the ADX line is heading up, strength is supporting the DI line that is on top and in control.
Check Out the Trade Alert Signal
Each candle on the chart represents price movement over a 5-day (week) period; therefore, it takes weeks for trades to play out. On the chart, the week is a bullish candle as I type. When the +DI crosses over the -DI line, it gives a buy signal (as the +DI line (green) appears as if it is in control and rising to head up on the ADX indicator, and as the ADX turns up that is even more bullish, suggesting an upward move is gaining strength. I’d like to see the green line to continue its upward bias and then the black line to turn straight up and head up as well. All are bullish signs of strength. When the +DI crosses the ADX (black line) and when it rises, it shows a new burst of strength coming into the equity.
The Black ADX line is a strength line and as it flips up and continues to head up, it shows strength, and we’ll know strength will continue to flow into this equity. We will keep an eye on LAZR over the course of the next few weeks.
If BA’s price moves above or stays above $230, you could consider a trade. The short-term price target for BA is $240 and then, perhaps, higher. With the swings in past months, I am suggesting small profit targets until a market trend starts again.
BA is a slightly higher priced equity and trading it may not be appropriate for all trading accounts, either way it is still a great equity to study to learn about the benefits of option trading.
BA Potential Trade – Showing Strength
This signal could give a quick payout if it continues its upward move, and the strength of this pattern continues. It looks as if it could push above $230. I am typing on Tuesday and BA started the day at $227.50 and is heading up, if it continues above 230 showing it is moving up, a trade could be considered.
To buy shares of BA would cost approximately $230 per share and if it reaches its near-term target of $240+ that would be a gain of $10 or 4.3%.
This is a great example of the benefits of trading options. Let’s discuss this as a study case.
Option trading offers the potential of a lower initial investment and higher percentage gain. Let’s take a look and make a comparison.
The plus DI (green line) is above the -DI and if it stays above the -DI (red) line and rises above $230 by Friday a call trade can be considered.
If you buy 3 shares at $230, you will invest $690. If the stock increases in price to $10, you will earn a profit of $10 per share or $30 for the 3 shares or about 4.3%.
If you bought one option contract covering 100 shares of BA with an Dec 3 (Dec wk1) expiration date for the $240 strike and premium would be approximately $2.48 today or $248 per 100 share contract. If price increased to the expected $240 target or a gain of $10 over the next few weeks, the premium would likely increase $6 to $8.48 ($6 x 100 share contract = $600 Profit.) $600 profit on your $248 investment, this is an 242% gain. Nice! Awesome trade if it hits it target!
Trading options is a win, win, win opportunity. Options often offer a smaller overall investment, covering more shares of stock and potential for greater profits.
I like to stress when trading options, you don’t need to wait for the expiration date to close the trade. You can close anywhere along the way prior to the expiration date. It is never a bad idea to take profit.
Trading options is like renting stocks for a fixed period of time. The potential to generate steady income with options is real and it can be transforming. Watch this video to learn how you can use option trading to achieve financial freedom. click here
Yours for a prosperous future,
Wendy Kirkland

Past Equity Candidates:
Three weeks ago, we looked at XOM with a Nov 26th (Nov wk4) expiration and a 70 strike with premium of .20. It did not play out as expected. On Friday early, it rose to 65.20 and then started dropping. Since then, it has not recovered. It’s premium as I type has experienced time decay and is at .03.
Two weeks ago, we studied PFE and a Nov 26th expiration (I think I listed 24th in error- there was no 24th – 4th week, it was 26th) and a strike of 50 with a premium of .15. It rose as high as .99 which is a gain of .84 or $84 on a $15 investment or 560% profit as I type this on Tuesday.
Last week, we examined LAZR and a Dec 3rd expiration on a 25 strike. On Friday, the premium to purchase was probably closer to .35. Monday it moved as high as .74 and now o Tuesday is back to .35. Quick moves. It still has a couple weeks until expiration.
See Related Articles on TradeWinsDaily.com
Aerospace Company Launches New Flight Pattern
Chart of the Week: PayPal Holdings (PYPL)
Top Three Market Reversal Signals
Pharmaceutical Company’s Chart Looks Healthy
© 2021 Tradewins Publishing. All rights reserved. | Privacy Policy | Terms and Conditions | Contact Us
The information provided by the newsletters, trading, training and educational products related to various markets (collectively referred to as the "Services") is not customized or personalized to any particular risk profile or tolerance. Nor is the information published by Wendy Kirkland a customized or personalized recommendation to buy, sell, hold, or invest in particular financial products. Past performance is not necessarily indicative of future results. Trading and investing involve substantial risk and is not appropriate for everyone. The actual profit results presented here may vary with the actual profit results presented in other Wendy Kirkland publications due to the different strategies and time frames presented in other publications. Trading on margin carries a high level of risk, and may not be suitable for all investors. Other than the refund policy detailed elsewhere, Wendy Kirkland does not make any guarantee or other promise as to any results that may be obtained from using the Services. Wendy Kirkland disclaims any and all liability for any investment or trading loss sustained by a subscriber. You should trade or invest only "risk capital" - money you can afford to lose. Trading stocks and stock options involves high risk and you can lose the entire principal amount invested or more. There is no guarantee that systems, indicators, or trading signals will result in profits or that they will not produce losses.
Some profit examples are based on hypothetical or simulated trading. This means the trades are not actual trades and instead are hypothetical trades based on real market prices at the time the recommendation is disseminated. No actual money is invested, nor are any trades executed. Hypothetical or simulated performance is not necessarily indicative of future results. Hypothetical performance results have many inherent limitations, some of which are described below. Also, the hypothetical results do not include the costs of subscriptions, commissions, or other fees. Because the trades underlying these examples have not actually been executed, the results may understate or overstate the impact of certain market factors, such as lack of liquidity. Wendy Kirkland makes no representations or warranties that any account will or is likely to achieve profits similar to those shown. No representation is being made that you will achieve profits or the same results as any person providing a testimonial. Testimonials relate to various other products offered by Wendy Kirkland and not the product offered here, but all of these products are based on Wendy Kirkland's system. Performance results of other products described in such testimonials may be materially different from results for the product being offered and may have been achieved before the product being offered was developed.
Results described in testimonials from other products or the product being offered may not be typical or representative of results achieved by other users of such products. No representation is being made that any of the persons who provide testimonials have continued to experience the same level of profitable trading after the date on which the testimonial was provided. In fact, such persons may have experienced losses immediately thereafter or may have experienced losses preceding the period of time referenced in the testimonial. No representation is being made that you will achieve profits or the same results as any person providing a testimonial. Wendy Kirkland's experiences are not typical. Wendy Kirkland is an experienced investor and your results will vary depending on risk tolerance, amount of risk capital utilized, size of trading position, willingness to follow the rules and other factors.
|
Tidak ada komentar:
Posting Komentar