Follow a Clear Trading Plan
Start Here
Market Overview:
S&P 500 futures continue to weaken, pressing deeper into momentum support as sellers stay active. The recent breakdown is no longer a one-day event—it's now part of a developing pattern where rallies fail quickly and downside tests arrive faster. The market has shifted into a caution phase.
Bullish/Bearish Trend Analysis
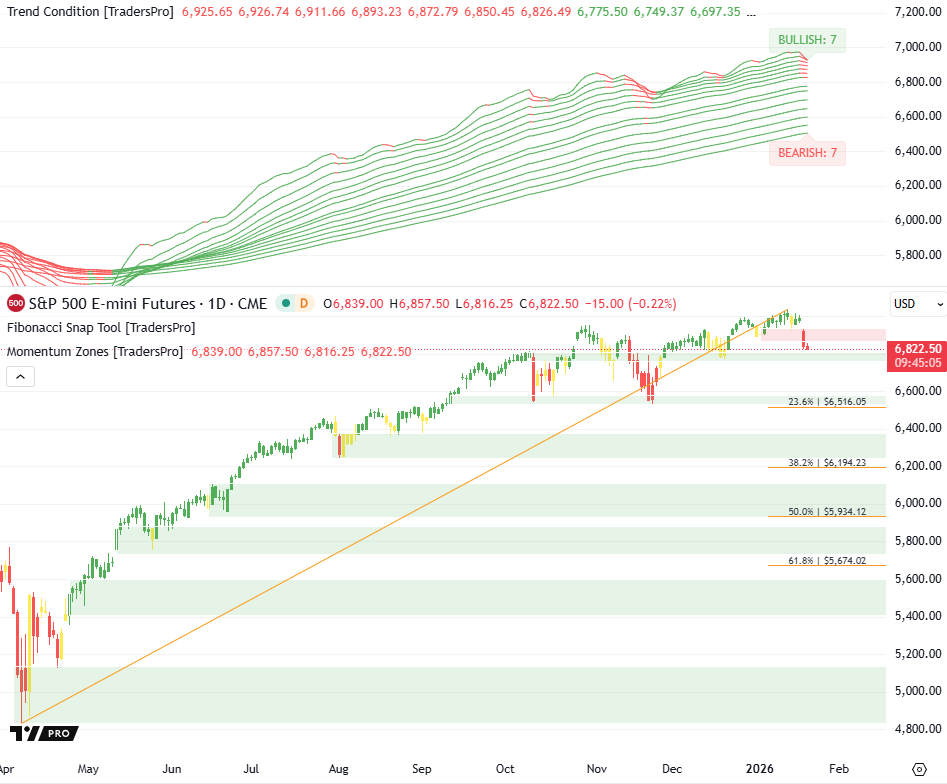
Trend Condition: Bullish Trends: 7 Bearish Trends: 7
Trend Condition: Neutralizing
Explanation: The trend stack is now evenly split between bullish and bearish EMAs. That symmetry is rare at market highs and usually signals a turning point. Momentum is no longer one-sided. Buyers don’t control slope, and sellers don’t fully own it either.
Trend Structure: compressing, flattening, and beginning to roll
Implication: The EMA structure is no longer widening or lifting. It is tightening and losing shape. Neutral stacks are unstable—they either resolve into a fresh trend or break into a deeper pullback.
Probability Outlook:
Continuation: ~20% given the loss of slope and balance in the stack.
Consolidation / Pullback: ~80% as bearish EMAs expand and upper momentum zones fail to hold price.
Charts by TradingView
Price Action and Momentum Zones
Current Price and Change:
S&P 500 Futures trade at 6,822.50, down 15.00 points (–0.22%) from the last session shown.
Market Behavior:
Price has now produced back-to-back weakness bars with little evidence of responsive buying. The market slipped beneath the recent rising trendline, showing that prior demand has thinned. Sellers are consistently testing lower zones, and buyers are showing hesitation.
Momentum Zones:
Price sits directly on a major demand block. If this layer gives way, the next zone opens a wider path toward deeper retracement levels. Stability depends on buyers defending this region decisively.
Fib Retracement Levels
Current Position Relative to Levels:
Price remains above the 23.6% Fib retracement highlighted on the chart.
Analysis:
Support still holds on the shallow Fib, but the tone is weakening. If the market closes below this level, momentum often accelerates toward the 38.2% band—especially when the trend stack loses directional bias, as it has now.
Overall Market Interpretation:
The trend has shifted from bullish dominance to a neutral, unstable structure. An even 7-and-7 split in EMAs. With momentum zones being tested and buyers failing to produce a strong defense, the market leans toward corrective behavior unless conditions improve quickly.
Follow a Clear Trading Plan
Start Here
Daily Trade Idea
Performance
Understand Risk
Tidak ada komentar:
Posting Komentar