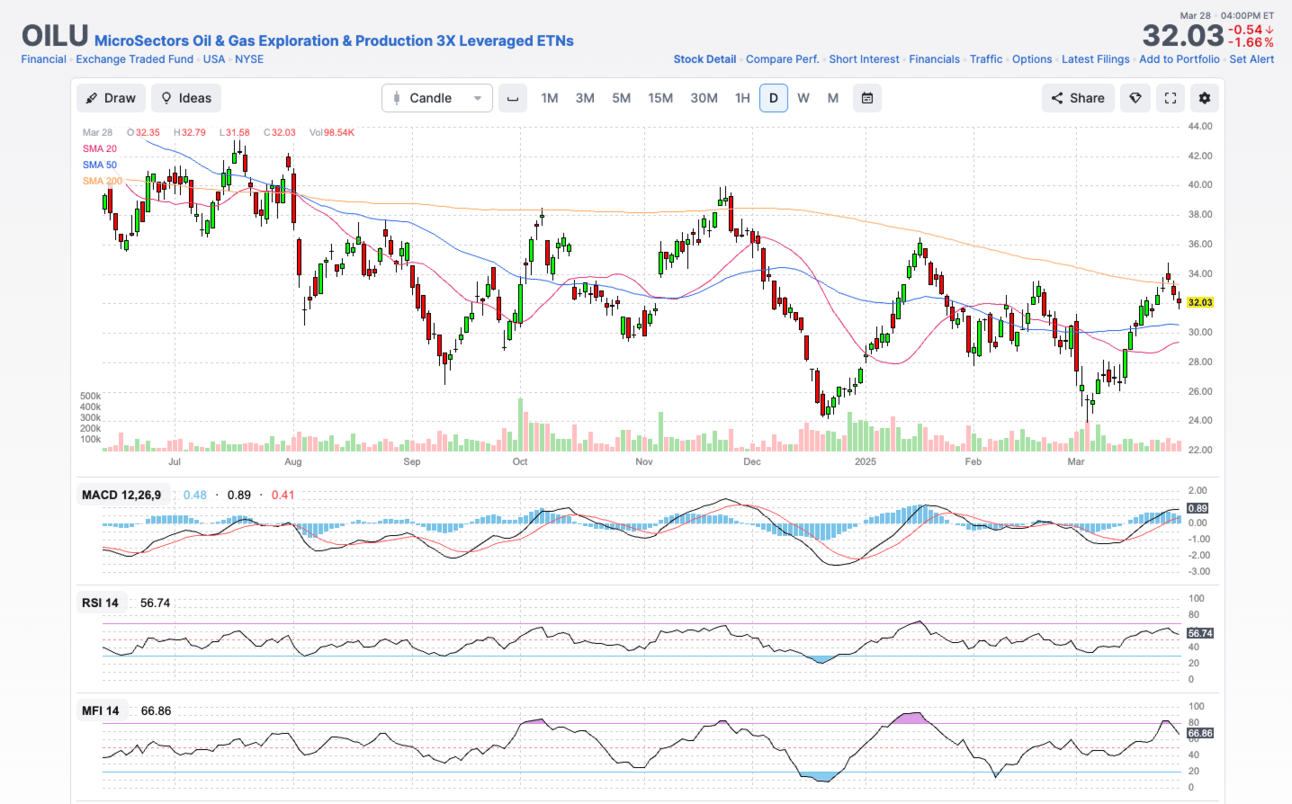
If this black line falls under this pink line... short these stocks... It's not complicated.
Editor's Note: Tomorrow, you can access the Billionaire's Secret… If you're worried about where the market is heading (or straight-up pumped for the benefits of trading in times of crisis), you need to listen to Dr. Jeff Bierman. Be sure to click this link, if only to learn how Warren Buffett and Bill Ackman are exploiting any crisis. | | Dear Fellow Trader: | Greetings from Sundance, Utah. | I could have been skiing today. | I arrived here, pulled up for lunch, and the lifts were running. It's quiet on the mountain. I could have had it to myself while I waited for the rest of my film team to arrive here this evening. Oh well… I'll watch the Orioles game and wait for the Airbnb to open up in a few hours. | I'm out here doing some documentary work on the energy sector. And before I start this trading week - I'm pulling up my favorite chart in all of finance (pronounced Fi-Nance… not phe-nance. My wife complains when someone says it wrong). | The MicroSectors Oil & Gas Exploration & Production 3X Leveraged ETNs (OILU). | The ol' OILU is a great chart to follow when looking for big moves in the upstream portion of the energy supply chain. I'm talking about the producers that pull oil out of the ground. Think EOG Resources (EOG), ConocoPhillips (COP), Hess Corporation (HES), and Devon Energy (DVN). | What's so important about this chart? | It's a terrific proxy for price action on the stocks I just listed… | | Now… look at the key technicals here. | This ETN does not like to stay above its 200-day moving average very long. It's coming out of overbought territory in both the Relative Strength Index (RSI) and the Money Flow Index (MFI). | These two indicators are both momentum indicators. The first measures price momentum and reaches overbought territory when the figure hits 70. The Money Flow Index measures price AND volume and reaches overbought territory at 80. | The MACD is slowing down - after a positive breakout around 27. If that turns around and we see that the black line falls under the Red Line… I want you to do something… | Pay attention to what happens to the price. If it drops under that pink line in the stock chart (the 20-day moving average), oil producer stocks could break down quickly. | You can see that the OILU cratered fast after falling under its 20-day moving average four of the last five times. This is the time to bet against the stocks in the underlying index of oil producer stocks. | Devon Energy (DVN) was just one of the few breakout stocks we saw in the last two weeks. Tomorrow morning, I'll walk you through the trade and the conditions you should make if we see the OILU drop under that level. | We're going to buy something called a Put Spread. | You'll get my trade for FREE tomorrow for tuning into TheoLive: Market Masters at 8:45 ET. (Of course… that's 6:45 MT for me… woof). | Waving to Brandon (Hey Man!!!) | I'm only out West for 48 hours… | As I arrived in Salt Lake City today, I had to wave in Brandon Chapman's general direction. If you haven't had the chance, please check out his encore presentation from Friday with Don Kaufman. | Now's the time to get active in the markets. As I said, Brandon's seeing things that no one else is in the mainstream financial press. Look at the data… not the headlines. | That's how you'll be successful in ANY market. | All right… this pulled pork sandwich has my name on it. | Stay positive, | Garrett Baldwin |
|
| | | | | Update your email preferences or unsubscribe here © 2025 TheoTrade Live Show PO Box 24790
Christiansted, Virgin Islands 00824, United States of America | | Terms of Service |
|
|
|
|
|
Tidak ada komentar:
Posting Komentar