AI Is Killing Buy-and-Hold Investing. Here’s What Replaces It. VIEW IN BROWSER 
There’s a quiet panic spreading through the investing world. It doesn’t show up in headlines. You won’t hear it on CNBC. But it’s there — in financial planning offices, in investment forums, even inside earnings calls. It sounds like this: “Why doesn’t this make sense anymore?” You probably think it’s about AI. That part is obvious. The media is fixated on who will win the AI arms race, how many jobs will disappear, and which companies will dominate the next decade. But that’s not the real disruption. The deeper shift is already happening – inside the market itself. Stocks now move faster, reverse harder, and disconnect from fundamentals more violently than at any point in modern history. The strategies that built generational wealth over the last fifty years still can work… but they no longer work the way investors remember. A century ago, the ticker tape compressed Wall Street into minutes. Then came computers, program trading, and the quant revolution. Today, the next compression is happening in microseconds. If you’ve felt that whiplash, you’re not alone. The market can surge 2% before lunch, plunge by the close, then erase the entire move the next morning… often without a headline large enough to explain it. The traditional advice to “own great businesses and wait” can still work over long stretches of time. But it now requires sitting through drawdowns that most people struggle to endure. This is because algorithms dominate today’s markets. But that’s only half the story. The truth is, they are today’s markets. Estimates suggest they account for roughly 70%–90% of daily U.S. equity volume. Layer in a surge of retail capital – with cash flows into U.S. stocks running 53% higher in 2025 than the year before – and you get a system wired for speed, emotion, and sudden air pockets. The human beings you picture on a trading floor, reading tape and making calls, are largely set dressing at this point. The real action is happening at the speed of light, in server farms in New Jersey, running models that have read more earnings transcripts and analyzed more price patterns than any human team could in a thousand lifetimes. Even time horizons have compressed. The average holding period has fallen from roughly eight years in the 1950s to about five months today. Bear markets that once arrived roughly once a decade are appearing far more frequently. Since COVID, we’ve experienced three, or roughly one every two years. I can hear folks saying, “That’s not normal!” But it is the new normal today. And the next phase may bring even more instability. Markets are moving beyond algorithms that execute predefined strategies toward AI systems that make decisions, adapt to new data, and respond to one another in real time. If volatility feels embedded today, further acceleration is likely. So what do you do when price and fundamentals drift apart? When blue-chip stocks such as Netflix (NFLX) or Nvidia (NVDA) routinely lose 35%, 50%, or 66% of their value before recovering, what does it mean? For many investors, the cost of staying the course has become too much to bear. So, in today’s issue, I’ll explore a framework that can help trade this market: stage analysis, popularized by Stan Weinstein. I’ll explain why “Stage 2” – when a stock breaks out of quiet consolidation into a sustained advance – is where the most meaningful gains often begin. You’ll also see why identifying these setups manually across 5,000-plus stocks is unrealistic, and how a systematic breakout scoring approach can help surface potential Stage-2 candidates before they become front-page stories. Why Buy-and-Hold Breaks Down In Volatile Markets AI’s impact on markets as a trading tool, where algorithms execute predefined strategies at machine speed, is only the first phase… The next phase is already taking shape, and it is far more consequential. AI agents – autonomous systems capable of making decisions, adapting to new information, and acting without direct human instruction – are moving from research labs into real-world deployment. And their influence on markets is still underappreciated. Imagine portfolio systems that no longer wait for quarterly meetings to rebalance. They adjust continuously, reacting in real time to earnings releases, macro data, price shifts, and even one another’s behavior. Imagine exchange-traded funds (ETFs) managed by adaptive agent systems that rotate in and out of positions dynamically based on live pattern recognition. Now consider the feedback loops that emerge when these systems respond not only to market conditions but to the reactions of other AI systems… cascades of automated decision-making unfolding in fractions of a second. We have already seen how coordinated algorithmic behavior can trigger flash crashes, liquidity vacuums, and sharp price dislocations. Expanding that framework to smarter systems managing larger pools of capital suggests an environment where volatility becomes even more embedded. The average stock holding period has already collapsed from roughly eight years in the 1950s to about five months today. In an agent-driven market, that compression is likely to continue. Long-term investors will have to compete against systems that process and act on information in microseconds. Holding a stock for years while waiting for fundamentals to assert themselves becomes increasingly difficult in an environment defined by rapid rotations and frequent drawdowns. The stress this creates is not theoretical. It shows up in real portfolios. Nvidia (one of the most wealth-creating stocks of the past decade) declined 56% in 2018, 3% in 2020, 66% in 2021–2022, and 37% in early 2025. 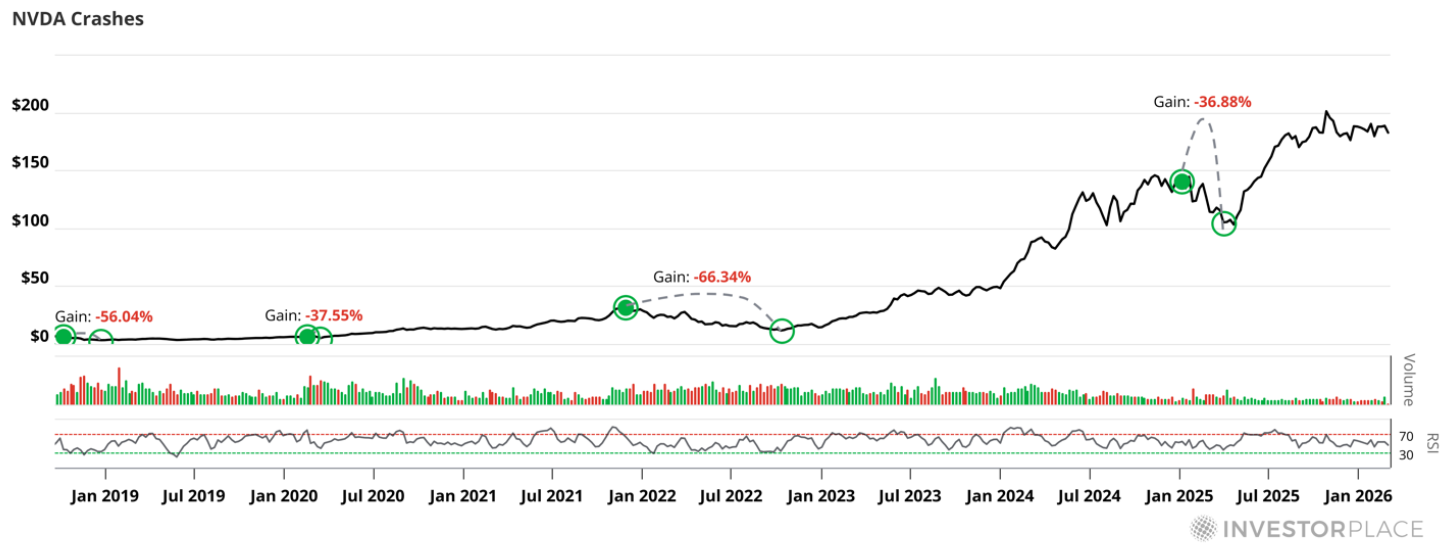
That is four 35%-plus crashes in just eight years, or about one every two years. The stock ultimately recovered and advanced, but enduring those losses required unusual discipline. But the academic version of “stay invested” glosses over the lived experience of watching a third (or half) of your wealth evaporate and being told “this is fine, this is normal, just hold…” Most people don’t hold. They sell at the bottom and buy back near the top, which is why retail investors chronically underperform the indices they’re theoretically tracking. This response is rooted in human psychology. Losses register more intensely than equivalent gains. At the same time, the relationship between fundamentals and price has become less reliable as a short- to medium-term guide. Opendoor (OPEN), despite deteriorating revenue and margins, rallied near-1,900% in little more than two months. 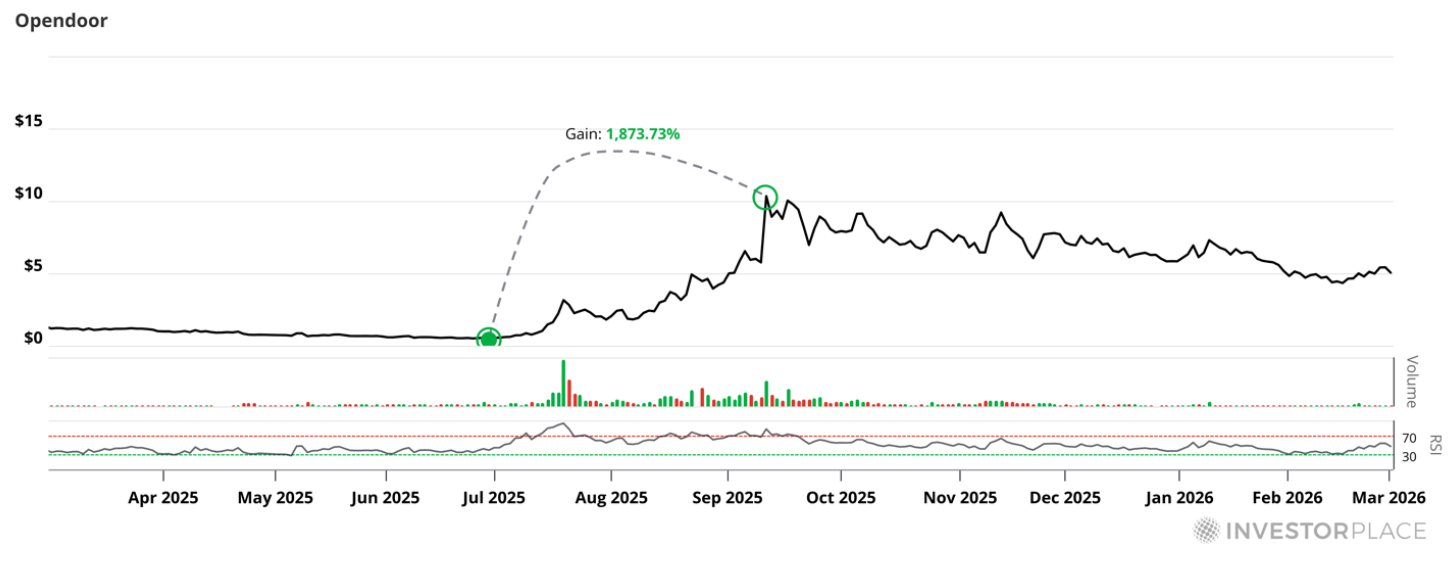
Zillow (Z), with record revenue and a dominant market position, gained less than 30% over the same period and finished the year down 7%. When a stock’s price has effectively decoupled from its business performance, fundamental analysis becomes a map to a territory that no longer exists. | Recommended Link | | | | OpenAI is gearing up for a historic IPO, and Silicon Valley insider Luke Lango has found a way for you to invest BEFORE the announcement is even made. You don’t need to file any special paperwork… buy shares from a former employee… have a source on the inside – or jump through any other hurdles. Best of all, all you need is just $10 to get started. |  | | Stage Analysis: The Framework Built for This World In a high-volatility, momentum-driven market, valuation alone isn’t enough. What matters most is where real money is flowing in real time. That’s the foundation of stage analysis, first systematized by trading pioneer Stan Weinstein in “Secrets for Profiting in Bull and Bear Markets.” The thesis is elegant in its simplicity: every stock moves through four recurring stages. - Stage 1: Consolidation – a long, quiet sideways base after a decline.
- Stage 2: Advancing – the breakout phase, when institutional money steps in and the price begins a sustained move higher.
- Stage 3: Distribution – momentum stalls as early buyers start taking profits.
- Stage 4: Decline – selling accelerates and the cycle resets.
The opportunity is concentrated in one phase: Stage 2. It ’s almost insultingly simple once you see it: buy Stage-2 breakouts, sell when Stage 3 begins, and avoid everything else. This is where Palantir moved from a single-digit stock to a triple-digit stock… 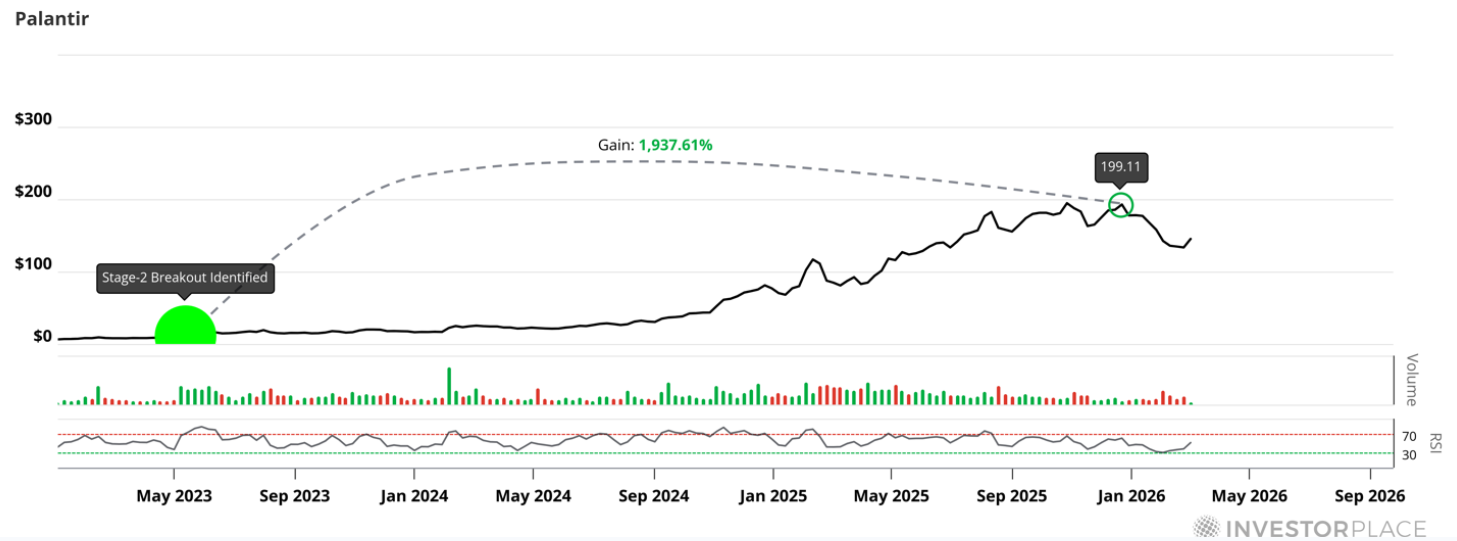
Where Carvana (CVNA) exploded more than 6,000% off its lows… 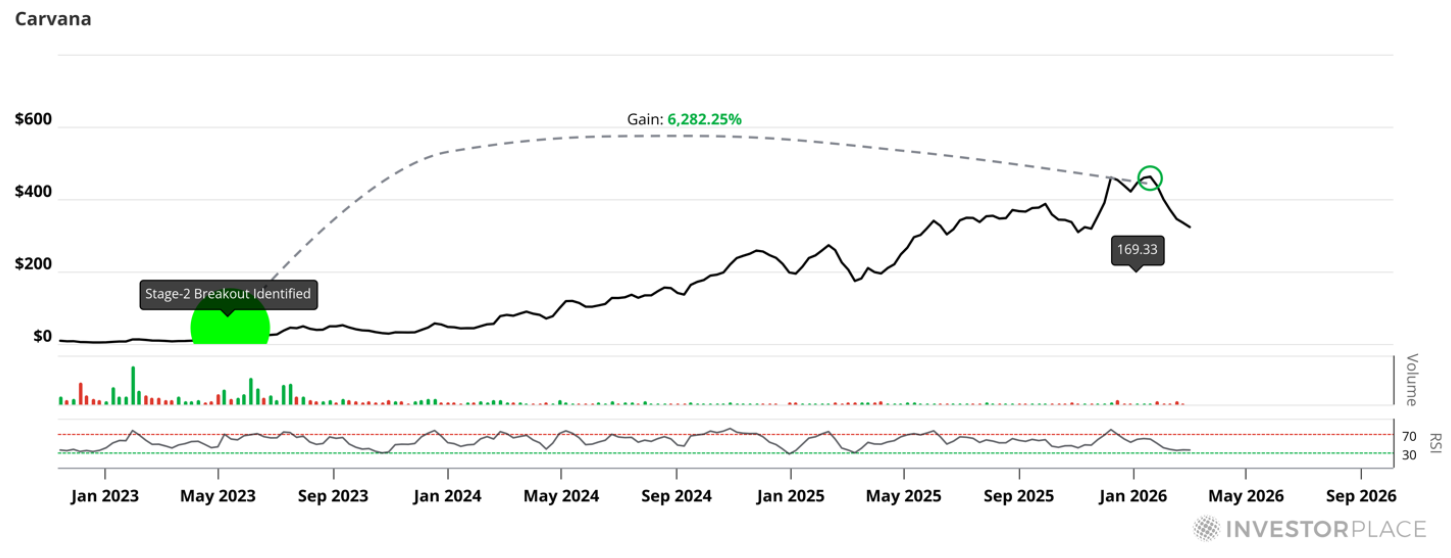
Where major advances begin (often before the headlines catch up). Stage analysis doesn’t try to forecast earnings or guess fair value. It identifies when accumulation is already underway and momentum is building. In today’s market, where leadership rotates quickly and volatility is constant, recognizing a stock entering Stage 2 can make the difference between chasing a move… and getting positioned early. In a moment, I’ll show you how we apply this framework across more than 3,000 stocks – and how it’s helping surface potential breakouts before they become apparent to everyone else. The Problem: You Can’t Do This by Hand at Market Speed To sum it up, the market you learned to invest in no longer exists. When 70%–90% of daily volume is driven by machines… when retail capital can flood in with a swipe… when leadership rotates in weeks instead of years… it can be expensive to hesitate. There are thousands of publicly traded stocks in the U.S. market. At any given moment, a small handful are quietly transitioning from Stage 1 to Stage 2… from sideways action into sustained advances. That transition is where the biggest gains tend to begin. You won’t consistently find those names by flipping through earnings reports on a Saturday afternoon. You won’t catch them by waiting for a TV segment. And once they’re trending on social media, the breakout is already well underway. That’s why we built a systematic Stage-2 breakout screener that scans more than 3,000 stocks and assigns each a 0-to-5 breakout score, based on the strength of its momentum setup. In historical testing, it identified eight of 2025’s top-performing stocks before their major advances began. It flagged Hycroft (HYMC) before a 1,100% run. Terns (TERN) before an 865% surge. And, again, Palantir (PLTR), long before it became one of the most talked-about AI stocks in the market. The goal is simple: identify stocks as institutional momentum builds, when price and volume confirm that something meaningful is happening. Volatility is part of the landscape now. Leadership changes quickly. Capital moves fast. You can try to keep up manually, sure. And I wish you good luck. Or… you can use a system built for this environment. See how it works by viewing my urgent presentation today. You’ll see what Stage 2 looks like on a chart. And you’ll learn which stocks are scoring highest in our system right now. The market won’t slow down, but you don’t have to fall behind. Sincerely, | 


Tidak ada komentar:
Posting Komentar