Bloomberg Signals New
Regime — We Don't Buy It Dear Reader,
Chief Research Analyst Matt Clark is the registered user of our team’s Bloomberg terminal. We pay a pretty penny for this each year, but it’s well worth the investment as it gives us access to the same tools and data that the most advanced institutional investors have.
Matt and I were recently discussing Bloomberg’s U.S. Equity Market Regime Model, as it just sent a “signal” about the broader market’s likely direction ahead (more on that below).
The model uses an algorithm that draws on the following components: - Correlation between S&P 500 member returns.
- Percentage the index lies above or below its 200-day moving average.
- Year-over-year change in the index’s price-to-book value (P/BV) ratio.
- Change in forward 12-month earnings per share estimates.
Realize…
These are metrics used by our very own Green Zone Power Rating system.
Let’s break it down… Similar … but Different Correlation between a stock and the market is a component of beta, a popular way to determine whether a stock is more or less volatile than the market. It is one of the metrics driving my system’s Volatility factor ratings.
The 200-day moving average is a Momentum measure … similar to what our Momentum factor metrics measure.
Price-to-book value is an obvious valuation metric, and a key component of our Value factor ratings.
Lastly, earnings-per-share (EPS) can be used to size up both a company’s Quality and Growth … which is precisely what we do.
All told, Matt and I felt you would be pleased to know that Bloomberg analysts use much the same factor analysis that we do here at Money & Markets!
That said, our approach to beating the market takes a divergent path from Bloomberg’s U.S. Equity Market Regime Model in how we use these factors.
Bloomberg’s is a “market-timing” model. Its aim is to distill the data highlighted above into a clear signal, pointing you to either be “in” or “out” of the market as a whole.
Bloomberg’s model does that by projecting the S&P 500’s future returns. Regimes are classified in three ways: - Green — When the S&P 500 is in the Green Regime, forward returns are accelerated.
- Yellow — When in the Yellow Regime, forward returns of the S&P 500 are moderate.
- Red — When in the Red Regime, projections are for poor results for the S&P 500.
Since 1996, the average forward 6-month returns for red regimes have been 0.1%, compared to 5.9% for yellow regimes and 8.5% for green regimes. 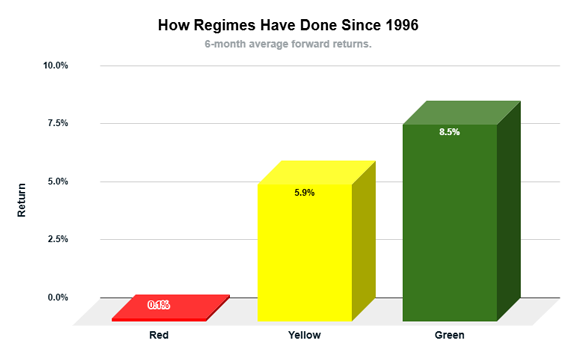 With the table set, let’s dig into the debate Matt and I were having about the regime Bloomberg’s model just recently signaled… What Regime Is the S&P 500 in Now? Last week, after the S&P 500 fell below its 200-day moving average and its year-over-year P/BV ratio dropped, the Equity Market Regime Model flipped to its “red” regime.
You can see in the chart below how the model had previously been in the yellow regime for 21 months — from June 2023 to February 2025. 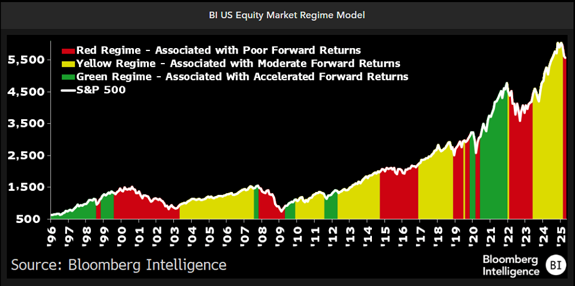 If you believe solely in the model, this turn to the red regime implies subpar performance for the S&P 500 ahead — not necessarily negative, but perhaps flat or low returns.
That said, while Matt and I respect the model’s use of metrics we know to be effective, we don’t agree with using it as an “all or nothing” market-timing tool.
And in this instance, in particular, we think there’s good reason to believe the model is likely to get “whipsawed” — that is, turn “red” too late to be effective.
Consider the catalyst of the recent stock market sell-off, which worked to put the model into the red regime…
Stock momentum turned negative after President Donald Trump’s retaliatory tariff announcement in April.
However, recent trade deals — notably with the United Kingdom and China — have quickly reversed market sentiment and momentum back to the positive side.
It’s too early to say for sure, but the current sell-off and recovery appear similar to the COVID-catalyzed panic in early 2020. That episode was severe but brief, ultimately resulting in what we call a “V-shaped” recovery … a pattern of market action that notoriously “whipsaws” market-timing models that find themselves woefully behind the curve, signaling “danger” after the damage is already done … and, ironically, just as the rapid recovery is already well underway.
All of this said, Matt and I wholeheartedly agree on this…
Rather than use a market-timing model that suggests you should either be “in” or out” of the market … your long run results should be far better by staying committed to investing in highly-rated stocks, using of course our Green Zone Power Rating system, which, as we showed, is driven by some of the same metrics as Bloomberg’s model.
Staying in the market even when a market-timing model says to get out can be psychologically challenging. But when you have the peace of mind knowing you’ve invested in quality, high-growth companies that are trading at fair or attractive valuations … with positive share price trends and momentum…
You can rest assured that you’ll participate in the full extent of the market’s bullish trends … something a market-timing model cannot give you.
To good profits, 
Adam O'Dell
Editor, What My System Says Today
P.S. To see how we’re using my model to target those stocks with market-beating momentum, click here to see how you can join my flagship Green Zone Fortunes investing service. |


Tidak ada komentar:
Posting Komentar