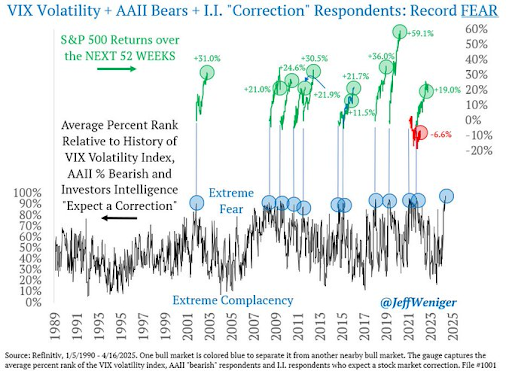
Contrarians UniteThe markets are closed today, so I'm going to keep this short. Jeff Weniger tweeted this chart. He writes: “You're looking at the highest reading on record in 1,841 weekly stock market sentiment observations from 1990 to 2025. The inputs: the VIX volatility index + AAII survey bearish respondents + Investors Intelligence survey respondents who expect a correction. In 10 of the last 11 fear spikes, the S&P 500 went on to gains over the next 52 weeks. Returns were often large too (+31.0%, +21.0%, and so on).”
That's pretty compelling. Great constrarians zig when the market zags. There is record fear in the market but the economic numbers are actually pretty good. Lets think about the bullish case for U.S. stocks and peer at the glass as if it were half full:
There is a solid argument to be made that the correction has already happened. I am seeing lots of charts of speculative tech companies that look like great buys. We are just entering earnings season with some potential bullish surprises. Don’t be shocked if we get a big rally out of this. All the best, Christian DeHaemer . Buy the stock when it touches this ONE line on the chart Forget the 10-day, 20-day, 200-day moving average for getting your trading signals. I'll show you my most reliable, trusted, and FREE indicator you can overlay on any stock chart on any stock charting software. It's my go-to for the last 30+ years of trading full-time. You would've opened positions on Tesla, Nvidia, Netflix, you name it...all before they took off. My name is Scott Redler. I'm one of the most trusted and well-known stock traders on Wall Street. You can get my #1 favorite indicator and my popular 23-page book on trading FREE. |
Jumat, 18 April 2025
Contrarians Unite
Langganan:
Posting Komentar (Atom)
Tidak ada komentar:
Posting Komentar