Editor's Note: After picking Nvidia in 2016, before shares jumped high enough to turn $10k into as much as $3.2 million, tech investing legend Jeff Brown is back with a much more explosive AI opportunity… A strange phenomenon that has been sending a small group of AI stocks exploding higher for gains of 917%, 1,416%, and 6,400% …all in a 24-hour period. Click here to RSVP to Jeff's upcoming strategy session to get the detailsor read more below.
Why Vistra (VST) Stock Could Be a Discount Ahead of Q4 Earnings
Posted On Jan 20, 2026 by Joshua Enomoto
Vistra(NYSE:VST) may not be the most enticing idea ahead of its fourth-quarter earnings disclosure, with VST stock having dipped more than 10% in the past 52 weeks. Nevertheless, the integrated retail electricity and power generation company based in Irving, Texas, stands on relevant ground. Thanks to its diverse energy portfolio — which includes natural gas, coal, nuclear and solar energy — Vistra plays an important role in the modern economy.
Table of Contents
However, this criticality has effectively reached an unprecedented level due to artificial intelligence. Increasingly, AI is no longer seen as a mere mechanism for productivity enhancement. Rather, the underlying protocols have been increasingly embedded in platforms and infrastructures, to the point that there will likely be two types of businesses: those who have embraced machine intelligence (and automation) and everyone else.
The problem for the latter category? There may be no situation where success is possible outside of AI.
To be fair, enterprises can't just rely on their industry's relevance; they must deliver the goods. And lately, Vistra has had a shaky record. Indeed, the last time that the company had a clean earnings report — where it beat on both the top and bottom lines — was back in November 2024.
That said, there's hope for VST stock considering that in the past five years, it gained almost 681%. With a solid showing, Vistra could get back on its feet.
For the upcoming earnings report — scheduled for Feb. 26 — analysts are looking for earnings of $2.43 per share on revenue of $17.19 billion. In the year-ago quarter, the energy giant posted earnings per share of $1.14 on sales of $4.04 billion. At the time, it was considered a mixed performance, with sales beating the consensus estimate of $3.79 billion but the bottom line falling well short of the $1.72 target.
Laying Out the First-Order Battlefield for VST Stock
Obviously, no one knows how the market will respond when Vistra releases its results — and anyone who claims otherwise is not being honest. That said, there are clues as to how much movement we can expect, and that comes from the implied volatility (IV) metric, which is a residual value stemming from actual order flows.
I like to think about IV as the aural quality of the wind created by vehicles passing you by on the roadway. From the output, we can approximate the velocity of the vehicle, though we of course would have no idea where the driver is ultimately headed. It's the same with a high IV count for a particular options chain. This reading would show an expectation of movement but without a clear directional bias.
For the March 20 expiration date — which would be roughly a month after Q4 earnings — IV clocks in at 53.25%, which is quite elevated. By contrast, the Feb. 27 expiration date shows IV of 54.44%. Therefore, the market is expecting relatively robust movement following the earnings disclosure.
Typically, IV data is plugged into the Black-Scholes formula to assess what the nominal dispersion may look like for select expiration dates. Again, for the March 20 date, we would be looking at an expected range from $139.96 to $194.10, representing a sizable high-low spread of 16.21% relative to the spot price of $166.60 (Friday's close).
At first glance, this "expected move" calculator seems insightful and it is because it lays out the battlefield of possibilities. However, when it comes to options trading (on the debit side), we are paying for the right to speculate on outcomes that may or may not materialize. In the case of the Black-Scholes-derived dispersion, the absolute spread between the two outputted figures is nearly 39%.
Imagine that you're on a search-and-rescue mission seeking out survivors of a shipwreck in the middle of the Pacific Ocean. You don't have the resources to search every square inch of water. Instead, you need to narrow down the search radius for the most probable area where survivors are likely to be found. That's where the Markov property comes to the rescue.
Searching for Probabilities, Not Just Possibilities
One of the most beautiful principles but almost completely overlooked in finance is the Markov property, which claims that the future (behavioral) state of a system depends solely on the current state. Essentially, the framework emphasizes the power of context when calculating forward probabilities.
Let's use a simple sports analogy. In football, a 25-yard field goal attempt would be considered a chip shot, practically automatic. However, if the Super Bowl was on the line amid inclement conditions, that no-brainer attempt would no longer be guaranteed. You must factor in the pressure and the weather when determining the probabilities of making the field goal.
What's problematic about Black-Scholes is that there's no mechanism within the formula to account for prior context. As such, volatility and the influence that it can exert on forward probabilities are treated as independent events. Under the Markov property, volatility is conditionally dependent on prior context.
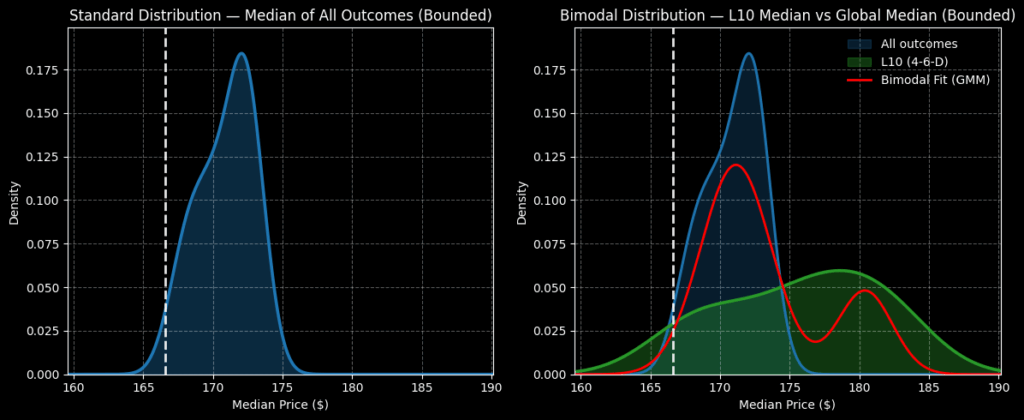
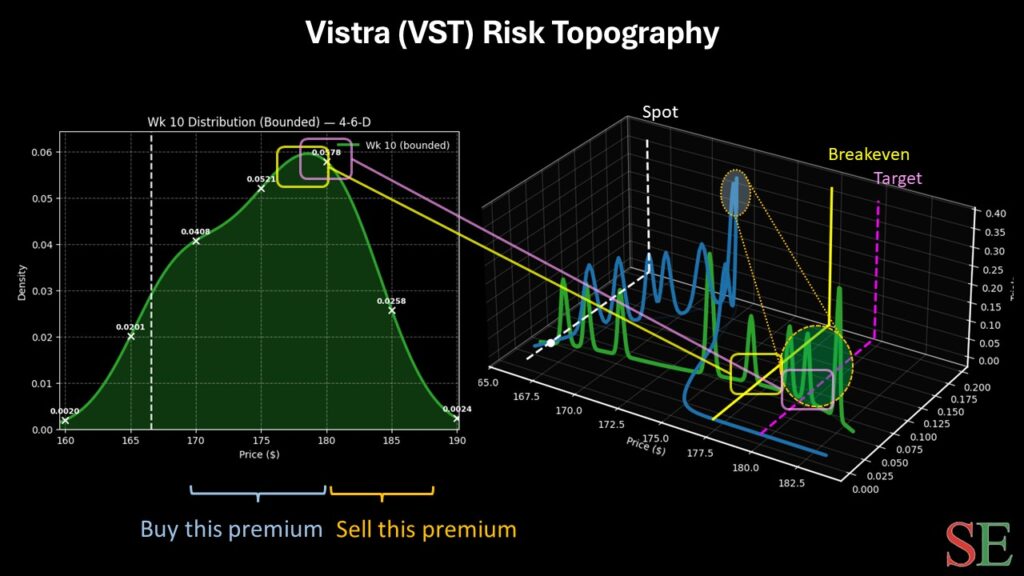
For VST stock, the recent behavioral state has been highly distributive, which will likely impact how the market will respond to the security in the future. Specifically, in the last 10 weeks, VST printed only four up weeks, leading to an overall downward slope. Under this setup, the forward 10 weeks would likely range between $157 and $193 (assuming a spot price of $166.60).
This output only modestly reduces the expected dispersion between approximately $140 $194. However, the beauty of the second-order Markov property is probability density. Basically, across many trials, most outcomes following the flashing of the 4-6-D sequence would land between $175 and $182. That's a much narrower spread of expected outcomes, and it organically points to a natural trade.
Basically, I'm looking at the 175/180 bull call spread expiring March 20, 2026. If VST stock rises through the $180 strike at expiration, the maximum payout would come out to over 108%. Breakeven lands at $177.40, adding to the trade's probabilistic credibility.
This is a PAID ADVERTISEMENT provided to the subscribers of StockEarnings Free Newsletter. Although we have sent you this email, StockEarnings does not specifically endorse this product nor is it responsible for the content of this advertisement. Furthermore, we make no guarantee or warranty about what is advertised above.
Your privacy is very important to us, if you wish to be excluded from future notices, do not reply to this message. Instead, please click Unsubscribe.
StockEarnings, Inc 33 SE 4th St, Suite 100, Boca Raton, FL 33432 USA W: 877.6.STOCKS StockEarnings.com


Tidak ada komentar:
Posting Komentar