October 15, 2024
Get Ahead of the Market's Movements with This Metric
Dear Subscriber,
 |
| By Bruce Ng |
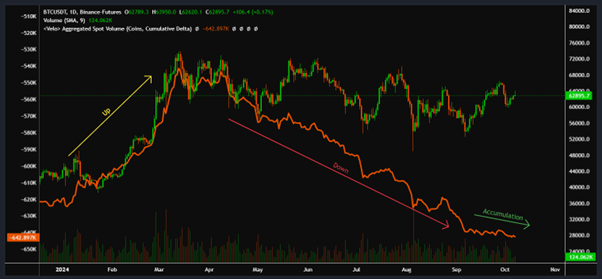
Last week, I told you about the spot CVD indicator.
This helpful tool shows if there is buying or selling pressure for a specific asset. This way, you can determine if a rally has what it takes to run … or of it’ll fizzle out.
And, as you saw, the selling pressure for Bitcoin (BTC, “A”) looks like it has finally run out, as shown by the “Accumulation” arrow at the bottom right below. That means we shouldn’t expect BTC to fall any further.
This is a powerful aid for investors. But it isn’t the only one. Turns out, there are two more metrics investors can use to suss out whether a rally is coming … or if positive price action is a passing trend.
And if all three occur together, the likelihood that a rally is around the corner is at its peak.
This week, I’ll review the second metric, which is …
Impulsive Price Action
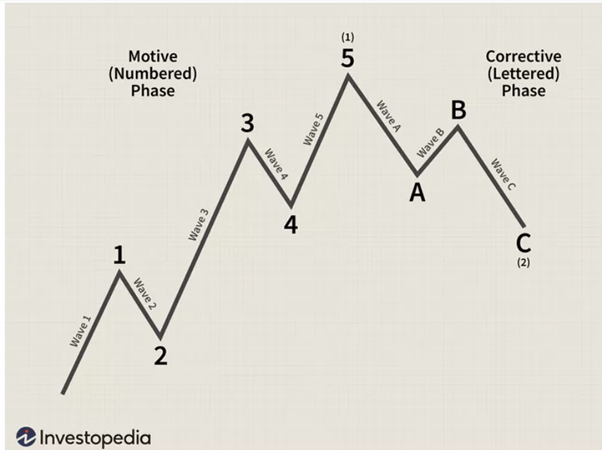
When markets move up or down, they do so in one of two ways: impulsive/motive or corrective.
Bear with me for a bit. This is about to get technical. I promise I’ve simplified this as much as possible.
An impulsive move — also called motive move in the image above — marks the start of a new trend, either to the upside or downside.
It consists of five waves, or cycles.
On an uptrend, that means you’ll see two higher lows — like points 2 and 4 above — and two higher highs — points 3 and 5.
And there are a few key rules that have to be met before we can call a price pattern an impulsive move:
- Wave 2 can’t retrace more than the start of Wave 1
- Wave 3 can’t be the shortest of Waves 1, 3 or 5
- Wave 4 cannot overlap with the price range of Wave 1
- Wave 5 needs to end in a correction
On the other side, we have a corrective move. These always move opposite to the trend before it and consist of only three waves.
So, if the impulsive move was to the upside, the corrective move will be to the downside, and vice versa.
What we want to see now on Bitcoin’s chart is an impulsive move to the upside. But before we look at current price action, we need to test this indicator. Let’s look back at BTC’s price history to see if this tip works.
We will first start by looking at the price action in the first quarter of this year. That’s when the price action confirmed a bull run following the announcement of a spot Bitcoin ETF:
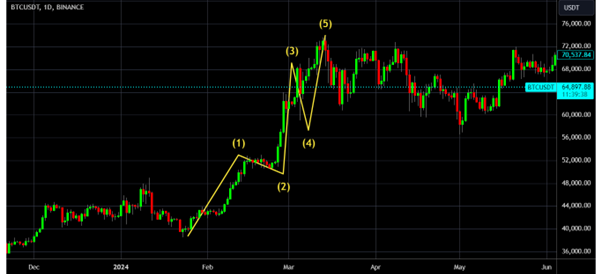
BTC/USDT on 1D in Q1 2024.
Click here to see full-sized image.
As you can see, there is a clear five wave structure. That tells me this was an impulsive move that shifted BTC out of its sideways action and into a bull run.
But this move above took over a month to play out. And if you’re not positioned before the price starts moving, you’ll miss out on some nice gains.
That means investors need a way of identifying the start of the trend earlier.
There are actually two ways you can do this.
- The easiest is to watch this video from my colleague Juan Villaverde.
His Crypto Timing Model follows key cycle highs and lows to better understand the best times for investors to act.
And his model is alerting that an important low is just ahead. To learn more about it — and what Juan believes will follow — click here.
- But if you want to go it alone, and you’re willing to put in the work, you can use a lower time frame.
See, impulsive waves work by building on one another. By that I mean the impulses on low time frames — such as an hour — will give a hint what you should expect for a high time frame, like a day.
The point is, if you want to find out early on whether a trend is an impulse, check the lower time frames first.
Let’s go back to BTC for our example. The overall time period for the chart is still between January and February 2024.
But instead of measuring price action for each day, we’ll chart the price action of each hour.
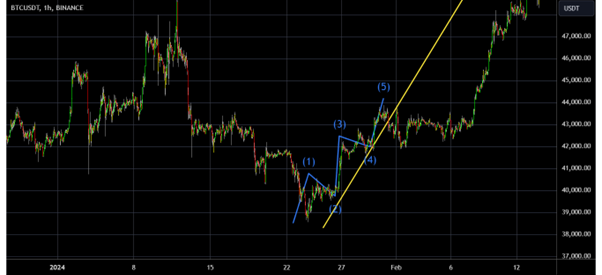
BTC/USDT on 1H in Jan.-Feb. 2024.
Click here to see full-sized image.
And look at that!
You can see another clear five-wave impulsive structure play out … but over the course of days, rather than months. And this pattern was established before the same pattern appeared on the chart marking the day-to-day price action.
The lesson here is this: If you want to find out when an impulse starts early, check the lower time frames.
Now that we’ve confirmed how the pattern played out in the past, let’s get back to the present day. I want to see if BTC’s latest move from $62,000 to $65,000 is impulsive.
And since we’re likely at the beginning of any move, I’m going to narrow my focus to the lower time frame of one hour.
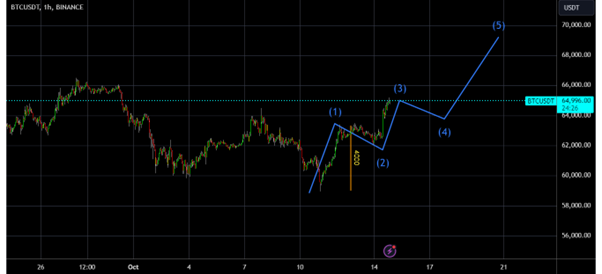
BTC/USDT on 1H.
Click here to see full-sized image.
So, is this an impulsive move?
Not yet … but the potential is there.
As you can see above, there is no clear five-wave pattern. BUT we can see the beginnings of one. We’ll need to pay close attention to how the yet-unfinished third wave resolves.
Here’s where the technical notes from earlier come in. For it to be an impulsive wave, wave 3 needs to be larger than wave 1 (approx. $4,000 in length). Which means, we’ll need wave 3 to hit at least $66,000 before the price corrects.
Following that, wave 4 needs to correct but not far enough to overlap with wave 1.
Let me be clear: Impulsive price action alone does not mean a rally is about to start.
But it is a useful tool in understanding the direction an asset will likely go in. When used with spot CVD, identifying impulsive price action is a proactive way investors can strengthen their case for the return of the rally … and tell us when it’s time to load up on our favorite cryptos.
And remember, this is only the second leg in a trio of tools I’m using to find the start of the next bull run.
Stay tuned for next week. That’s when I’ll reveal the final indicator you should watch for.
Best,
Dr. Bruce Ng


Tidak ada komentar:
Posting Komentar