Kamis, 19 Agustus 2021

Definitive Proof That This is a Bubble...

Money & Crisis

August 19, 2021

UNSUBSCRIBE | ARCHIVES

Definitive Proof That This is a Bubble...

Is Trump’s Prediction Finally Coming True?

Trump warned America that if Joe Biden was elected that the stock market would “disintegrate”.

But still, millions of people chose to help get Biden and the Do-Nothing-Democrats “elected”...

Now we ALL might have to pay the price.

Because according to this information, we may be just days away from one of the biggest stock market sell-offs in history.

There is nothing left for the rest of us to do but prepare…

Because once this crisis hits there will only be two kinds of people…

Those who survived and those who didn’t…

[Click Here If You Want to See How to Be One of the Survivors]


Graham SummersDear Money & Crisis Reader,

As I’ve been outlining over the last few days, stocks are in a bubble.

The evidence is clear from multiple angles.

One of the simplest is Warren Buffett’s favorite indicator: the Stock Market Capitalization to GDP ratio. Buffett famously used this ratio as the justification for avoiding the Tech Bubble in the late '90s. As the below chart shows, the current bubble is even larger than that!

FRED stock chart

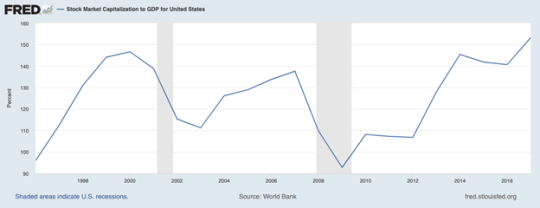
Another means of determining whether or not the market is in a bubble is from fund inflows, which measures how much capital investors are putting into stocks. After all, in order to have a genuine bubble, we need to see mania from investors as they dump their money into stocks.

Well, investors are pouring hundreds of billions of dollars into stocks today at a pace far exceeding anything like the last 12 years. Indeed, as CNBC noted earlier this year, investors have put more money into stocks in the last five months than in the prior 12 years combined.
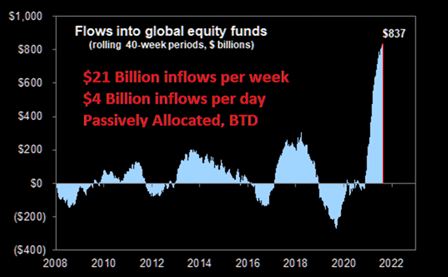
Flows into global equity funds

Is Apple’s New Breakthrough Going To Change The World?

Apple’s newest breakthroughis far bigger than the iPhone or anything they’ve done before.

In fact, experts say it could completely replace the iPhone over time.

You can see it pictured right here.

And anyone who takes action now could have the shot at incredible profits…

Click here for this shocking prediction.

Finally, we can assess whether or not stocks are in a bubble based on how stretched they are above historic norms.

One of my favorites is the 50-month moving average (MMA). As you can see in the below chart, one of the clearest signs of stocks entering a bubble is when they become extremely stretched above this line.

SPX chart

Obviously, today stocks area quite stretched above this line. However, the above chart makes it somewhat difficult to gauge just how far they are extended.

The bottom box in the below chart shows just how extended above the 50-MMA the S&P 500 is in a percentage. Today, the market is about 40% above the 50-MMA. It has only been higher three times in the last 40 years: right before the 1987 Crash and the twice during the Tech Bubble.

SPX double chart

So again, stocks are clearly in a bubble. It's now just a matter of figuring out when it bursts.

I’ll do that in tomorrow’s article. Until then…

Best Regards,

Graham Summers

Graham Summers
Editor, Money & Crisis

04ghd74j - 3b95 - dt38 - 43vg - g7sp38gt

See this 32-digit code?

While it’s just for illustrative purposes, it’s the prototype for a brand-new digital infrastructure that is set to replace the “old internet” as we know it.

Act now to be early on the “new internet”…

Continue Reading >>

Three founders Publishing

Tidak ada komentar:

Posting Komentar