 Dear Money & Crisis Reader, Dear Money & Crisis Reader,
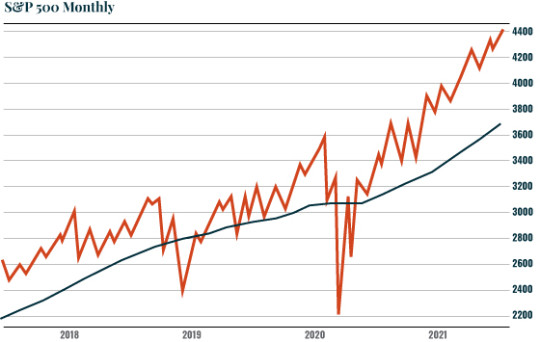
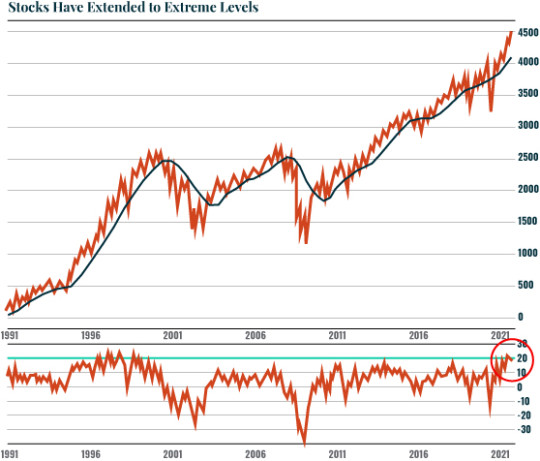
The market is now beyond overstretched by historical metrics. One of the best metrics to determine this is the 20-month moving average (MMA). As the chart below shows, this line has served as a kind of “reversion to the mean” for the market anytime it’s too stretched to the upside or downside. As you can see, today the S&P 500 is extremely overstretched above this line. 
But just how stretched is it? The chart below tells us the S&P 500 is roughly 20% above this line. This is the MOST the market has been stretched above its 20-MMA going back for 20 years. Indeed, the only time the market was MORE stretched above this line was during the Tech Bubble! 
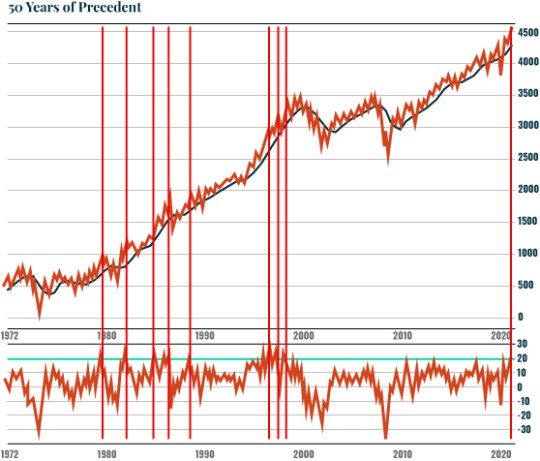
Running back a full 50 years, there were only eight times the market became this stretched. 
Five of them took place during the 1980s. Two of those lead to a significant correction of 10% or more. One was the 1987 crash. One of the two remaining saw the market chop sideways, and one saw it rip higher. |
Tidak ada komentar:
Posting Komentar