 Dear Money & Crisis Reader, Dear Money & Crisis Reader,
Over the last two days, we’ve been outlining how the market dynamic has changed. As a quick review: - Last week stocks closed down on Friday (unusual) as well as down on the week (even more unusual). Moreover, they finished near the lows (very unusual).
- Certain sectors (Industrials, Materials, Consumer Discretionary) are telling us that something BAD is brewing in the real economy.
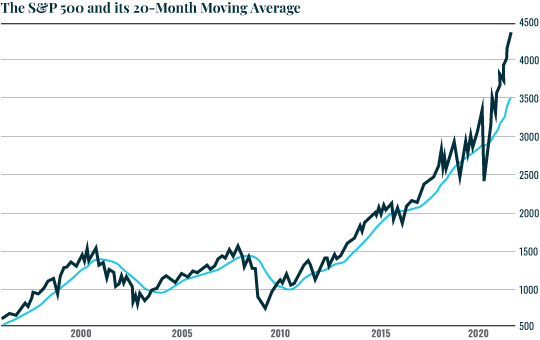
The big question today is… just how bad could things get for the markets? To gauge that, let’s take a look at a long-term monthly chart of the S&P 500 relative to its 20-month moving average (MMA). First and foremost, you can see that the 20-MMA is of great importance for the stock market, typically acting as a level of support during bull markets. The second thing I’d like to point out is that the S&P 500 is EXTREMELY extended above its 20-MMA today. 
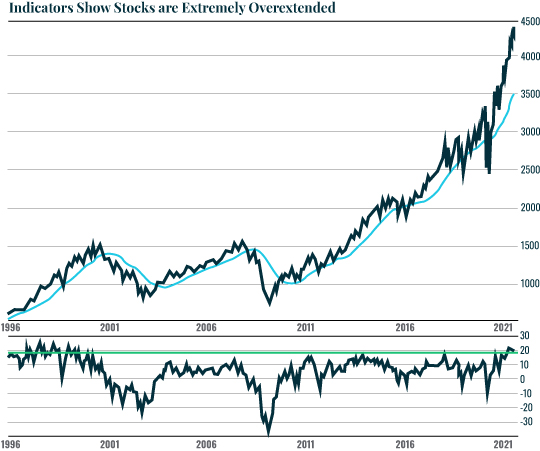
The chart below does an even better job of illustrating just how stretched stocks are today. The bottom half of the chart shows the S&P 500 is roughly 20% above its 20-MMA. This is furthest the market has been stretched above this line in 20 years. Indeed, the only time stocks have been MORE stretched above the 20-MMA in the last THREE DECADES was at the height of the Tech Bubble: the single largest stock market bubble of all time. 
Every time stocks have stretched this far above their 20-MMA, they’ve corrected to test this line. This would mean the S&P 500 falling to test 3,500 or so. 
But are we going to enter a major crisis? |
Tidak ada komentar:
Posting Komentar