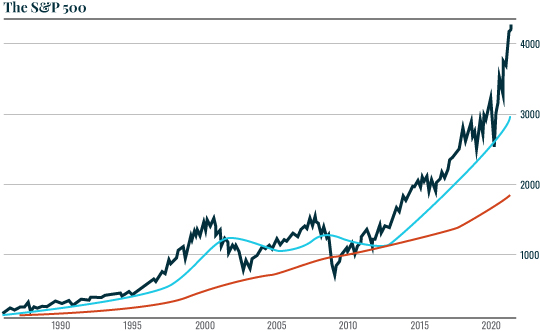
| This is a long-term chart of the S&P 500 along with its 50-month and 200-month moving averages (MMAs). As you can see, the 50-MMA is of extreme importance to the stock market. During bull markets, the S&P 500 usually bounces hard off this line. And at the start of bear markets, a breakdown below this line is usually the first sign that a bull market is over. 
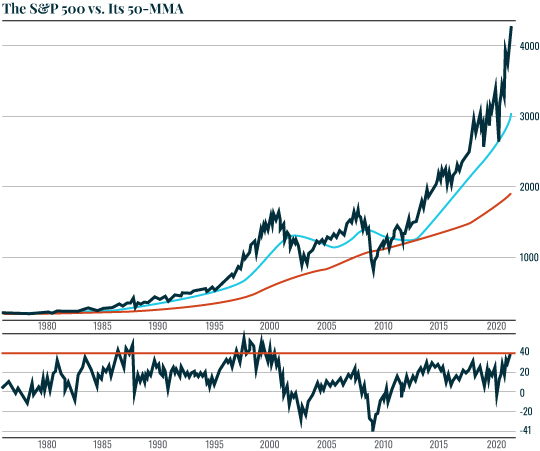
The key item I want to draw your attention to is just how stretched the S&P 500 is above its 50-MMA. The chart below has an added lower box that shows stocks are currently 38% above that level. It’s also worth noting that the market has been stretched above this level only two times before: during the Tech Bubble of the late ‘90s and right before the 1987 crash. Suffice to say, both of those instances resulted in pretty dramatic drops. 
It’s important to note the fact that stocks being stretched this far above the 50-MMA doesn’t necessarily mean that a crash is imminent right here and now. As I’ve just shown you, stocks have been even more stretched than this during past bubbles. Moreover, with the Fed making it clear it wants stocks to roar even higher, we could indeed see stocks become even MORE stretched above their 50-MMA. It’s never smart to fight the Fed. And until stocks do “something wrong” I wouldn’t sell the farm just yet. But for certain, when this bubble bursts, we’re in for a spectacular collapse to at least the 50-MMA, which would mean a drop to 3,000. And if stocks enter a new bear market, then we’re talking about a drop to the 200-MMA which would mean stocks falling by more than 50% to 2,000. Best Regards, 
Graham Summers
Editor, Money & Crisis |
Tidak ada komentar:
Posting Komentar