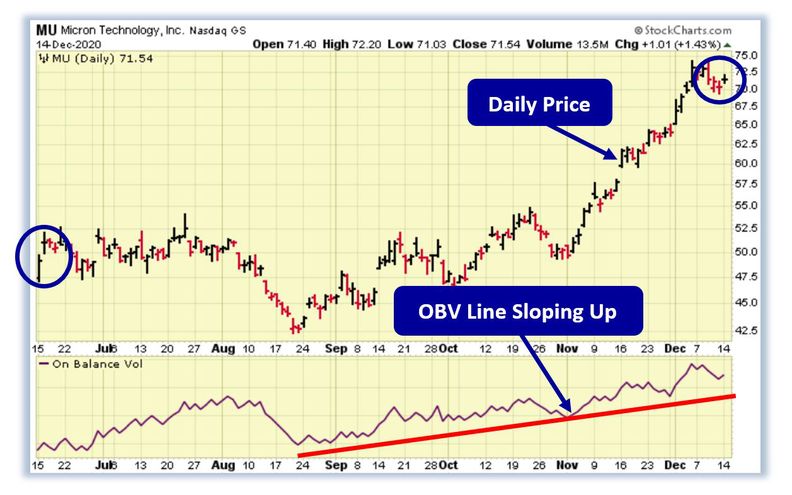
December 15th, 2020 Buying Pressure Pushes MU Stock Higher Dear Reader, Yesterday, we looked at a Daily Price Chart of Etsy Inc., noting the stock's 50-Day EMA is trading above the 100-Day EMA signaling a 'Buy'. For today's Trade of the Day we will be looking at an On Balance Volume chart for Micron Technology, Inc. stock symbol: MU. Before breaking down MU's OBV chart let's first review which products and services are offered by the company. Micron Technology, Inc. designs, manufactures, and sells memory and storage products worldwide. The company operates through four segments: Compute and Networking Business Unit, Mobile Business Unit, Storage Business Unit, and Embedded Business Unit. It offers memory and storage technologies, including DRAM, NAND, NOR, and 3D XPoint memory under the Micron and Crucial brands, as well as through private labels. The company provides memory products for the cloud server, enterprise, client, graphics, and networking markets, as well as for smartphone and other mobile-device markets; SSDs and component-level solutions for the enterprise and cloud, client, and consumer storage markets. Confirming a Price Uptrend with OBV The MU daily price chart below shows that MU is in a price uptrend as the current price is above the price MU traded at six months ago (circled). The On Balance Volume chart is below the daily chart. On Balance Volume measures volume flow with a single Easy-to-Read Line. Volume flow precedes price movement and helps sustain the price uptrend. When a stock closes up, volume is added to the line. When a stock closes down, volume is subtracted from the line. A cumulative total of these additions and subtractions form the OBV line. On Balance Volume Indicator ● When Close is Up, Volume is Added ● When Close is Down, Volume is Subtracted ● A Cumulative Total of Additions and Subtractions form the OBV Line Volume flow precedes price and is the key to measuring the validity and sustainability of a price trend. We can see from the OBV chart below that the On Balance Volume line for MU is sloping up. An up-sloping line indicates that the volume is heavier on up days and buying pressure is exceeding selling pressure. Buying pressure must continue to exceed selling pressure in order to sustain a price uptrend. So, On Balance Volume is a simple indicator to use that confirms the price uptrend and its sustainability. The numerical value of the On Balance Volume line is not important. We simply want to see an up-sloping line to confirm a price up trend. | 


Tidak ada komentar:
Posting Komentar