March 21, 2025
The Case for Crypto's Q2 Rally
Dear Subscriber,
 |
| By Juan Villaverde |
The headline on my previous Weiss Crypto Daily update was: “Good News for the Shell Shocked.”
That good news was the fact that my analysis said that the broad market selloff was almost done.
Sure enough, my Crypto Timing Model has recently confirmed how right we were. That’s because it’s showing that the crypto markets actually bottomed March 11 — just one day ahead of the model’s forecast for a March 12 low.
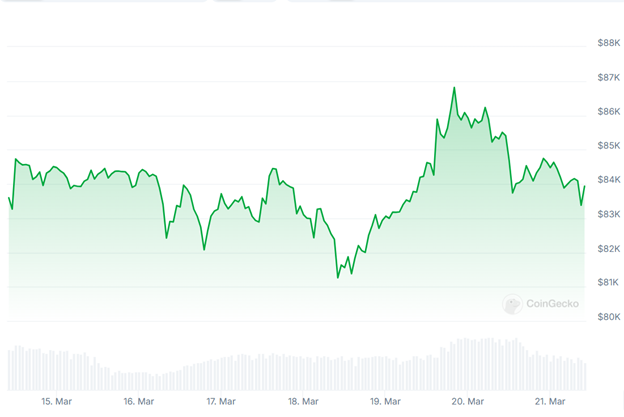
From under $80,000, Bitcoin (BTC, “A-”) managed to scramble up to about $86,000 before settling near $84,000 at the time of writing.
If we just look at BTC’s price, there are no indications this low will turn out to be of major significance.
But that changes once you also account for global liquidity.
That’s basically, the total dollars, euros, sterling, Chinese yuan, etc., in circulation worldwide.
And the best way to see that is through a chart of global M2, or money supply. It’s an excellent proxy for world liquidity, and it’s marked by the black line below:
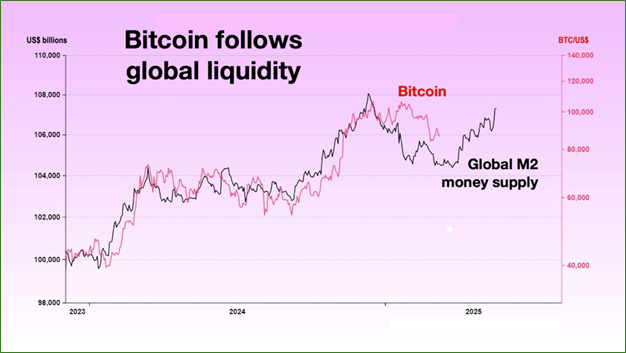
Bitcoin vs Global M2 shifted forward 10 weeks.
Source: LSEG Datastream, Bloomberg, Global Maco Investor, courtesy Raoul Pal.
Click here to see full-sized image.
The red line is Bitcoin. And a quick glance reveals that Bitcoin prices tend to mimic changes in Global M2 about 10 weeks later.
In the current case, M2 topped out in early October. Fast-forward 10 weeks, and that takes you to mid-December. That’s when Bitcoin topped out.
I’ve been expecting this drawdown since I saw liquidity top out back in October.
Understanding the interplay between crypto and liquidity is critical. Fortunately, it’s also quite simple: If global M2 starts to decline while Bitcoin continues to rally, you look for a major top a couple months later.
The last time we saw this divergence was between October and December 2024. That’s when Bitcoin was rallying … as liquidity was falling. Eventually, this gap needed to close, and Bitcoin had to fall back in line with global liquidity.
The good news is that just the opposite is occurring now.
Global M2 has been rallying since January, while crypto assets have taken a beating during that same period.
And guess what?
Global M2’s low was about 10 weeks ago. So, it’s now time for a major low in Bitcoin and the rest of crypto.
But look again at the BTC/M2 chart above.
You can see that, while global M2 is going up now, it actually peaked last year. So far, the rebound is quite impressive — consistent with the grand, four-year crypto and macro cycles.
But it remains below the highs made in 2024.
This implies a strong Bitcoin rally strongly for the next two to three months. Though how high it’ll go is another matter.
From a purely global liquidity standpoint, it’s unclear whether Bitcoin can make new all-time highs in the anticipated Q2 rally. Or if the rebound will take prices back to the low six-digit range before another top forms.
That’s where my Crypto Timing Model comes in. It can help us look beyond the 10-week horizon.
Now, it doesn’t give specifics. But what I can say for now is that Bitcoin — and select, high-quality altcoins — looks poised to party.
That is, I expect these assets to hit all-time highs as soon as the latest global liquidity boost filters into crypto markets — which should start happening right about now.
However, lots of other altcoins likely won’t join in.
So as crypto markets prep for their next run-up, we continue to see a bifurcation.
Some high-quality assets soar to new all-time highs, while many others lag.
That’s why I encourage you to keep up with our Weiss Crypto Daily updates.
While past performance is no guarantee of what could happen in the future, we’ll continue to highlight the most promising projects and top narratives.
This way, you’ll be able to focus your watchlist and stay up to date on the latest crypto happenings.
To your wealth,
Juan Villaverde


Tidak ada komentar:
Posting Komentar