|
|
Don Kaufman here. |
Tomorrow's Nonfarm Payrolls is going to be HUGE for the market… |
This isn't my opinion, it's what the market is telling me. |
How do I know this? |
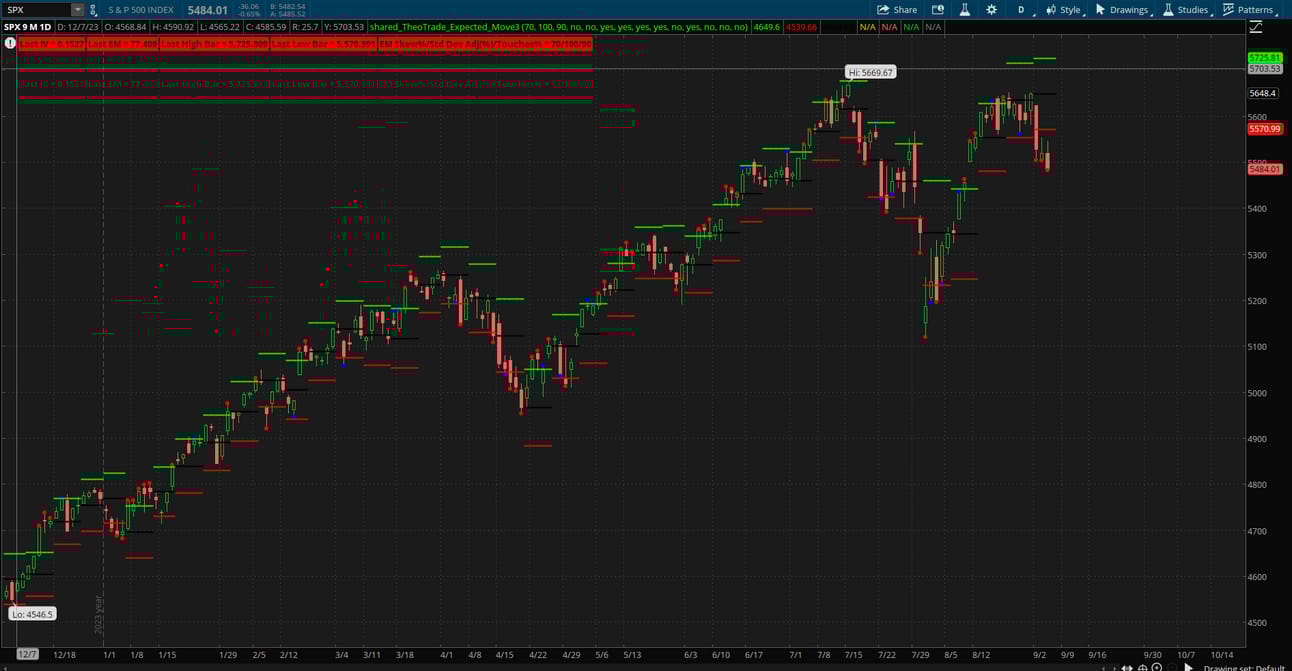
The auto expected move for tomorrow in the SPX is 72 points! |
|
It has to be the largest NFP expected move I've ever seen… |
Today I'll explain to you what the auto expected move is, and how I used it to score a 30% profit in WFC in 24 hours… |
Understanding the Auto Expected Move Indicator in Greater Detail |
The Essence of Expected Moves |
When we talk about expected moves, we're essentially discussing what the market anticipates will happen to a particular asset's price over a specific time frame. |
This expectation isn't just a random guess – it's derived from options pricing, specifically the implied volatility embedded in option premiums. |
How the Indicator is Calculated |
The auto expected move indicator uses complex mathematical models to interpret options data. It looks at factors like: |
Current price of the underlying asset Option strike prices Option premiums Time until expiration
|
By analyzing these elements, the indicator can determine a range within which the market expects the asset to trade by a certain date. |
Forward-Looking and Historical Analysis |
One of the most powerful aspects of our auto expected move indicator is its dual functionality: |
Forward Projection |
It calculates where the market expects the asset to move in the future. This is invaluable for planning trades and setting realistic targets. |
Historical Regression |
The indicator also applies this analysis to past data, allowing traders to see how accurate previous expectations were. This historical context can help refine trading strategies over time. |
Practical Applications in Trading |
Identifying Potential Breakouts or Reversals |
When an asset's price approaches the edge of its expected move, it often signals a critical decision point. |
A break beyond the expected move could indicate a significant trend continuation, while a reversal at this level might suggest a potential trend change. |
Options Strategy Selection |
Understanding the expected move can guide options strategy selection. For instance, if the expected move is small, it might suggest using strategies that profit from low volatility, like iron condors. |
Conversely, a large expected move might favor strategies that benefit from significant price changes, such as long straddles. |
Risk Assessment |
The expected move provides a data-driven basis for assessing trade risk. It helps answer questions like: "What's the probability of the asset moving beyond this point?" or "How much could I potentially lose if the market moves against me?" |
Why It's a Game-Changer for Traders |
Objectivity in a Subjective Market |
Trading often involves a lot of subjective analysis. The auto expected move indicator brings an element of objectivity, basing projections on actual market pricing rather than personal opinions or biases. |
Time Efficiency |
Before this indicator, I used to spend considerable time manually calculating and drawing expected moves. |
Now, traders can instantly apply this analysis to any optionable asset, freeing up time for other aspects of trade planning and analysis. |
Adaptability to Market Conditions |
The indicator automatically adjusts based on current market conditions. If volatility increases, the expected move will widen accordingly, providing real-time feedback on changing market dynamics. |
Advanced Usage Techniques |
Combining with Other Indicators |
While powerful on its own, the auto expected move becomes even more potent when combined with other technical indicators. |
For example, using it alongside support and resistance levels can help identify high-probability trade entry and exit points. |
Multiple Timeframe Analysis |
By applying the indicator to different timeframes – daily, weekly, monthly – traders can gain insights into both short-term swings and longer-term trends, allowing for a more comprehensive trading approach. |
Sector and Market Analysis |
Applying the indicator to sector ETFs or broad market indices can provide valuable context for individual stock trades, helping to align trades with overall market expectations. |
How I Used The Auto Expected Move To Profit 30% in 24 Hours |
|
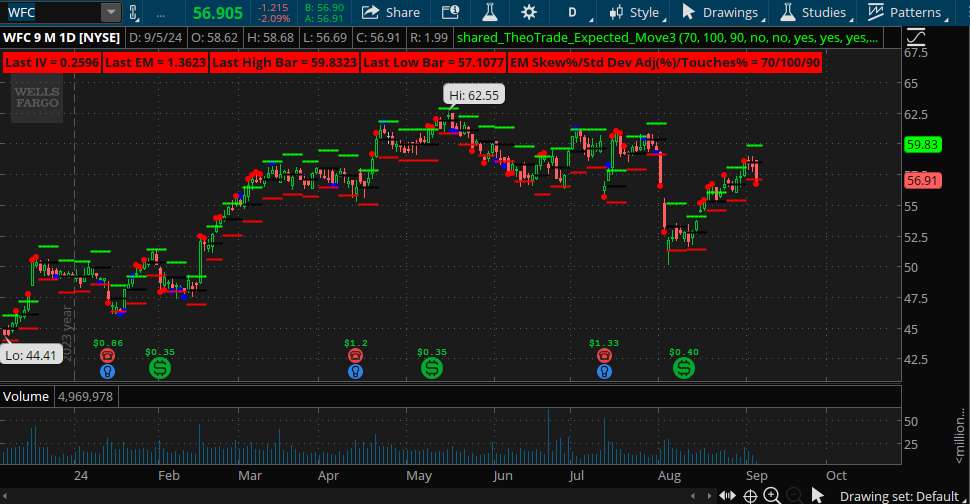
Yesterday I bought an Oct 4 $59/$57 put spread in WFC utilizing my In/Out Strategy. |
Now, it had nothing to do on my opinion of the company. |
What got me interested in the trade is WFC had 3 breaches of the expected move in 3 straight weeks. |
Statistically speaking, it's unusual for a low-volatility stock WFC to trade like this. |
Sometimes momentum stocks like Tesla and Nvidia can blast through the upper edge of the expected move, and stay extended for some time. |
But when you see it happening to a low volatility stock like WFC, I'm willing to bet it pulls back, which is exactly what happened today, with shares dropping by 2%. |
Now, 2% might not sound like much…but it was enough to capture a 30% profit utilizing my In/Out Strategy. |
How To Get The Auto Expected Move Indicator For FREE |
The auto expected move indicator is not just a tool, but a window into market psychology and expectations. |
It transforms complex options data into actionable trading information, providing traders with a significant edge in their decision-making process. |
By mastering its use, traders can enhance their ability to anticipate market moves, manage risk effectively, and potentially improve their overall trading performance. |
For a limited time you can get your hands on it for FREE… |
CLICK HERE FOR THE DETAILS. |
To your success, |
Don Kaufman |
P.S. I also took profits on IWM today, 55% winner from a trade I put on in Aug 23. All thanks to the auto expected move indicator. |
If you'd like to find out how you can get it for free, click here. |

Tidak ada komentar:
Posting Komentar