
Happy Marvelous Monday!
I help teach people to earn money trading options. It isn’t hard. I explain in easy-to-understand terms when I teach or write a book—like we are talking across the kitchen table.
If you haven't visited the site were we archive all of these articles, please check it out. The articles are often posted as early as 24 hours in advance of the emails being sent out every morning. You can see it here: https://www.tradewinsdaily.com/category/daily-profit-play/
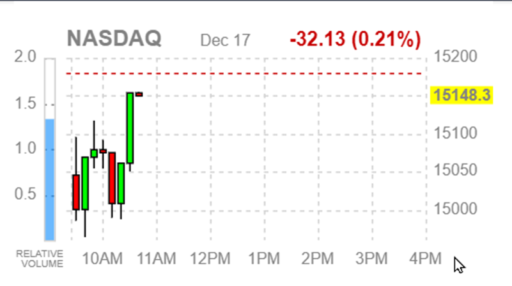
The Nasdaq was down 4 days out of 5. The bearish days wiped out last week’s gains and tested recent lows. The high volume rise last week seems to have put in a high. Price rose and then went flat close to recent highs and now has dropped again to test the bottom. Back and forth.
For updates on previous trades, please scroll down.
I am going to focus on the NASDAQ on Mondays and call it “QQQ Monday”. I will focus on QQQ which is the ETF covering companies traded within the NASDAQ Exchange Traded Fund.
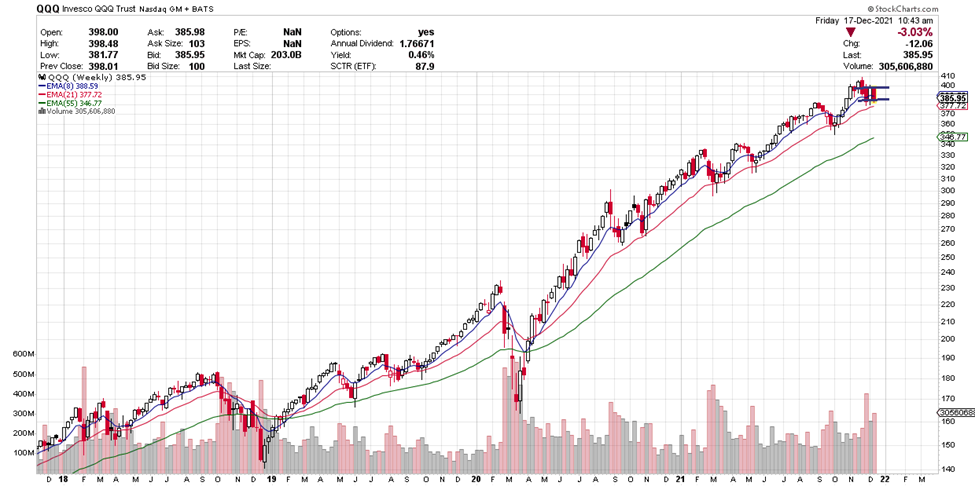
For today’s discussion, we will be looking at Invesco QQQ Trust, symbol (QQQ).
Before analyzing QQQ’s charts, let’s take a closer look at the ETF and its services.
Invesco QQQ is an exchange-traded fund that tracks the Nasdaq-100 Index™. The Index includes the 100 largest non-financial companies listed on the Nasdaq based on market cap. These companies are often cut-edge tech stocks and trendier companies.
The image below is Friday’s price activity – mid-morning.
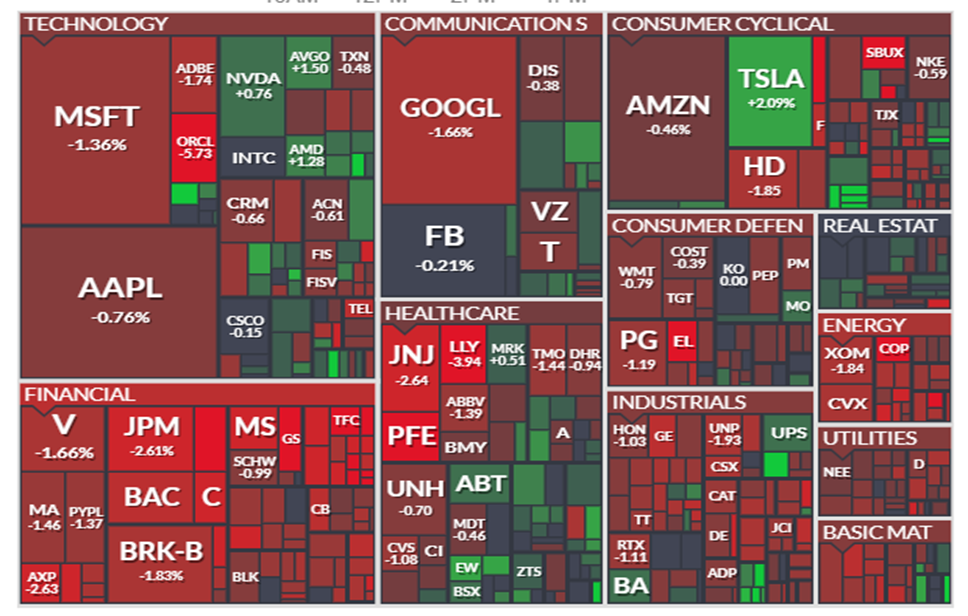
This chart image is courtesy of FINVIZ.com a free website and gives a quick view of each day’s movement.

This is an image from Friday where it dropped throughout most of the day. The carpet shows a lot of red. Many of the symbols with 4 or 5 letters are included in the QQQs- AAPL, AMZN, GOOGL, etc.
Fibonacci Exponential Moving Averages (EMA)
Exponential moving averages (EMAs) reduce the lag seen in simple moving averages by applying more weight to recent prices. The weighting applied to the most recent price depends on the number of periods in the moving average. We are applying 8, 21, and 55 weekly periods for our entry signals. EMAs differ from simple moving averages in that a given day's EMA calculation depends on the EMA calculations for all the days prior to that day. You need far more than 10 days of data to calculate a reasonably accurate 10-day EMA.
There are three steps to calculating an exponential moving average (EMA). First, calculate the simple moving average for the initial EMA value. An exponential moving average (EMA) must start somewhere, so a simple moving average is used as the previous period's EMA in the first calculation. Second, calculate the weighting multiplier. Third, calculate the exponential moving average for each day between the initial EMA value and today, using the price, the multiplier, and the previous period's EMA value.
Charting services like Stockcharts.com and your broker’s chart service figure these calculations for you.
As mentioned, entry signals are based on the use of 8, 21, and 55 weekly averages. (8, 21 and 55 are Fibonacci numbers which are a special sequence of numbers which are added together- 1+1= 2, 2+1=3, 2+3=5, 5+3= 8, etc. 13, 21, 34, 55, 89, 144, 233, 377, 600… As mentioned, we are zeroing in on 8 EMA (short term), 21 EMA (medium term) and 55 EMA (long term).
Let’s See Why This Signal Potentially Offers Potential Trade Info
Each candle on the chart represents price movement over a 5-day (week) period. QQQ is apt to continue to drop or flatten out if the EMAs curl down, going lower. In March and May this year, price pulled back toward the 21 EMA and then, bounced up off that area. The last 3 weeks price have been up and down, as seen above, switching between red and black every other week with the end result being flat. It seems the pullback is over for the moment and yet price is now back down to the area where it seemed stuck. It needs to break above or below one of the lines to determine the new direction. We will see.
As long as the 8 EMA remains above the 21 EMA and the 8 and 21 EMA both remain above the 55 EMA, said to be in uptrending order, its current uptrend will remain intact, and price will continue to rise or go flat. Price has closed back above the 8 EMA which is again bullish. With last week’s upward move and down this week, we will likely have an indecisive final month of 2021. We will keep an eye on QQQ’s movement over the course of the couple weeks.
Potential Profit Play for QQQ
Last week, the QQQs reversed and erased what had happened the previous week. The majority of days were bearish, and price is back to where it was when it dropped two weeks ago. There is no way of knowing what will happen Monday with a weekend to pause, but I suspect it will go up or go flat near this area.
General info:
Options often offer a smaller overall investment, covering more shares of stock and potential for greater profits, as well as making money when the price of a stock drops.
Possible trade:
If price continues to rise on Monday, you could consider a call trade if it moves above 400. If price drops below 380 you could consider a put trade.
To understand the difference between a stock purchase and an option, let’s make a comparison, if you bought 2 shares of QQQ stock for 400 per share, you would invest $800. If it rises to $405 you would have a gain of $5 per share or $10 or a gain of 1.2%.
Now let’s compare to an option trade. If you selected a 405 strike Call option and paid a premium of $1.50 for the Jan 10th (Dec wk1) expiration. If price rise from 400 to 405, rising $5 dollars in the stock’s price, the call premium is apt to go up about $2.50. Premium of $1.50 plus $2.50 = $4 or a profit of $2.50 per share or $250 for the 100-share contract. That is a profit of 167%
If price drops below 380, you could consider a Put trade where premium benefits when price drops. Today is a down day as I type on Friday and the premium is high around 5.98 per share or $598 per contract. It seems escalated because today is bearish and down.
Remember, you can take profit anywhere along the line, you don’t have to wait for the expiration date to sell. It is often wise to take profit when it is earned, especially in a volatile market.
If price drops below the support line, it can be wise to sell to reduce loss. As the expiration date nears, the premium will lose an increasing time value.
EMAs and line crosses are at the heart of most of my strategies. Many strategies come with a weekly newsletter listing numerous potential trade candidates.
I love teaching and sharing. It is my “thing”.
Yours for a prosperous future,
Wendy Kirkland
PS-I have created this daily letter to help you see the great potential you can realize by trading options. Being able to recognize these set ups are a key first step in generating wealth with options. Once you are in a trade, there is a huge range of tools that can be used to manage the many possibilities that can present themselves. If you are interested in learning how to apply these tools and increase the potential of each trade click here.
Past trade update:
There has been no trades the last two weeks because price never moved above the support/resistance lines that were needed to consider a trade. The market is in a period of transition and deciding on a direction.
See Related Articles on TradeWinsDaily.com
Chart of Week: Beyond Meat (BYND)
This Indicator Reveals the Next Move
© 2021 Tradewins Publishing. All rights reserved. | Privacy Policy | Terms and Conditions | Contact Us
The information provided by the newsletters, trading, training and educational products related to various markets (collectively referred to as the "Services") is not customized or personalized to any particular risk profile or tolerance. Nor is the information published by Wendy Kirkland a customized or personalized recommendation to buy, sell, hold, or invest in particular financial products. Past performance is not necessarily indicative of future results. Trading and investing involve substantial risk and is not appropriate for everyone. The actual profit results presented here may vary with the actual profit results presented in other Wendy Kirkland publications due to the different strategies and time frames presented in other publications. Trading on margin carries a high level of risk, and may not be suitable for all investors. Other than the refund policy detailed elsewhere, Wendy Kirkland does not make any guarantee or other promise as to any results that may be obtained from using the Services. Wendy Kirkland disclaims any and all liability for any investment or trading loss sustained by a subscriber. You should trade or invest only "risk capital" - money you can afford to lose. Trading stocks and stock options involves high risk and you can lose the entire principal amount invested or more. There is no guarantee that systems, indicators, or trading signals will result in profits or that they will not produce losses.
Some profit examples are based on hypothetical or simulated trading. This means the trades are not actual trades and instead are hypothetical trades based on real market prices at the time the recommendation is disseminated. No actual money is invested, nor are any trades executed. Hypothetical or simulated performance is not necessarily indicative of future results. Hypothetical performance results have many inherent limitations, some of which are described below. Also, the hypothetical results do not include the costs of subscriptions, commissions, or other fees. Because the trades underlying these examples have not actually been executed, the results may understate or overstate the impact of certain market factors, such as lack of liquidity. Wendy Kirkland makes no representations or warranties that any account will or is likely to achieve profits similar to those shown. No representation is being made that you will achieve profits or the same results as any person providing a testimonial. Testimonials relate to various other products offered by Wendy Kirkland and not the product offered here, but all of these products are based on Wendy Kirkland's system. Performance results of other products described in such testimonials may be materially different from results for the product being offered and may have been achieved before the product being offered was developed.
Results described in testimonials from other products or the product being offered may not be typical or representative of results achieved by other users of such products. No representation is being made that any of the persons who provide testimonials have continued to experience the same level of profitable trading after the date on which the testimonial was provided. In fact, such persons may have experienced losses immediately thereafter or may have experienced losses preceding the period of time referenced in the testimonial. No representation is being made that you will achieve profits or the same results as any person providing a testimonial. Wendy Kirkland's experiences are not typical. Wendy Kirkland is an experienced investor and your results will vary depending on risk tolerance, amount of risk capital utilized, size of trading position, willingness to follow the rules and other factors.
|
Tidak ada komentar:
Posting Komentar