| The Monetary Consequences of COVID-19  Dear Money & Crisis Reader, Dear Money & Crisis Reader,
Yesterday, I outlined why central banks were unable to create inflation from 2008-2016, despite cutting interest rates over 650 times and printing over $12 trillion in new money. As a brief review, the reason why none of these policies ignited inflation was because very little of this money made its way into the economy. Put another way, banks were not lending this money into the economy. Instead they were using it for financial speculation in stocks and other asset classes. Policymakers’ response to the COVID-19 pandemic, however, has been a whole other ballgame. First and foremost, central banks have been MUCH more aggressive with their money printing. As I mentioned, between 2008 and 2016, central banks printed $12 trillion. More than HALF of this ($7 trillion) has come in the last six months. Throw in stimulus programs from governments and the number balloons over $15 TRILLION. Put another way, it previously took policymakers EIGHT years to spend $12 trillion. They’ve already committed to spending MORE than this in less than SIX months. Also, and this is key… between stimulus payments and central bank lending facilities directly to small businesses/Main Street, much of this money is actually going straight into the economy. In the U.S., we’ve already seen one stimulus program of $3 trillion. The government is now in talks for a second stimulus program of $1 trillion. On top of this, the Fed has put over $1.6 TRILLION in actual real money into the U.S. economy in the form of credit facilities. Add that up are you’re talking about $5+ trillion in new money entering the economy this year. The U.S. Dollar Is Falling for a Reason Let’s put this into perspective. The U.S. economy is roughly $22 trillion in size. So, in the span of six months, policymakers are planning to funnel an amount of money equal to nearly 25% of U.S. GDP directly into the economy (right now the number is $4.6 trillion, but it will hit $5.6 trillion with the next Stimulus Bill). THAT’s how you get inflation. And it’s the reason the $USD is dropping like a brick. The $USD has lost 4% of its value thus far this year. However, that number is somewhat misleading since the $USD spiked during the March COVID-19 crisis. In reality, peak to trough, the $USD is down a whopping 12%. 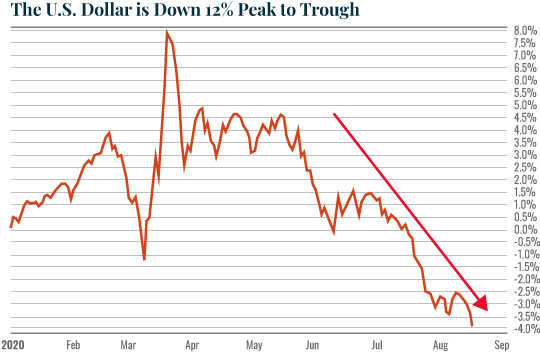 What’s particularly important to note is that the $USD continues to plunge week after week. Aside from the occasional consolidation period, the trend is decidedly DOWN. In this big picture, the greenback is rapidly approaching the bottom of the range that has determined price action for the last FIVE years. I believe we could very well see the $USD break below the 2018 lows sometime in the next 12 months. 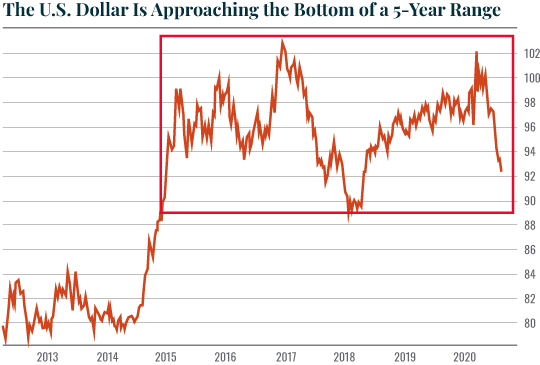 Why? | 


Tidak ada komentar:
Posting Komentar